Estimated Value: $204,000 - $218,000
2
Beds
2
Baths
1,170
Sq Ft
$181/Sq Ft
Est. Value
About This Home
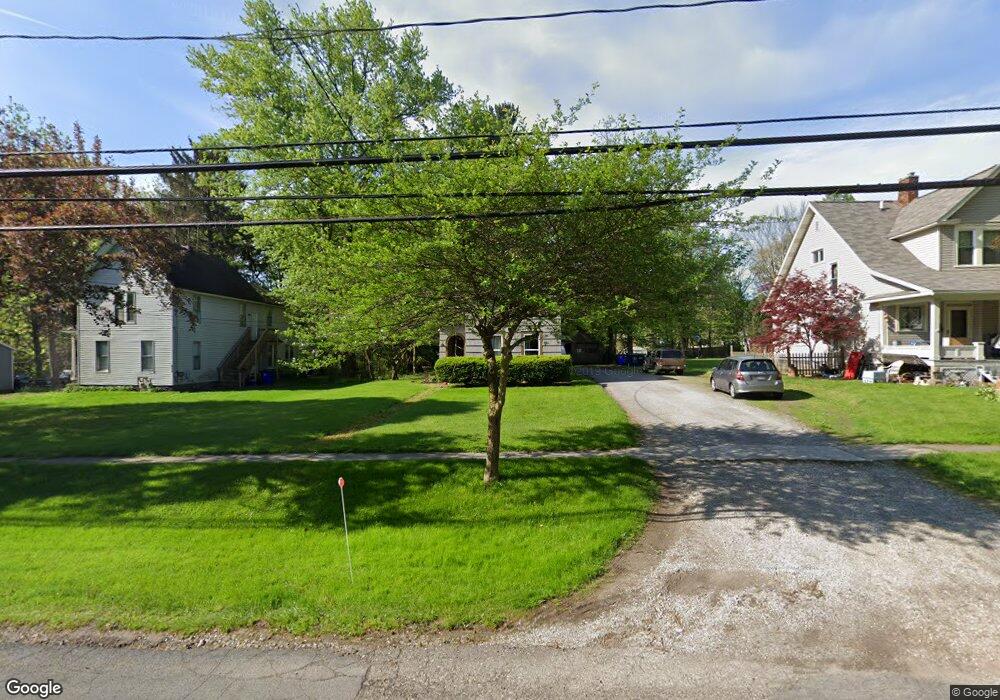
This home is located at 462 Carthage Ave, Kent, OH 44240 and is currently estimated at $212,041, approximately $181 per square foot. 462 Carthage Ave is a home located in Portage County with nearby schools including Harlean Beal Elementary School, Davey Elementary School, and Stanton Middle School.
Ownership History
Date
Name
Owned For
Owner Type
Purchase Details
Closed on
Jun 30, 2025
Sold by
Covenant Properties And Investments Llc
Bought by
Atherton Mykenzie
Current Estimated Value
Home Financials for this Owner
Home Financials are based on the most recent Mortgage that was taken out on this home.
Original Mortgage
$188,500
Outstanding Balance
$188,178
Interest Rate
6.81%
Mortgage Type
New Conventional
Estimated Equity
$23,863
Purchase Details
Closed on
Aug 15, 2024
Sold by
Kilmer Debora L and Siefer John M
Bought by
Covenant Properties And Investments Llc
Home Financials for this Owner
Home Financials are based on the most recent Mortgage that was taken out on this home.
Original Mortgage
$131,250
Interest Rate
6.95%
Mortgage Type
Construction
Purchase Details
Closed on
Mar 1, 2024
Sold by
Siefer Terri L and Siefer Michael L
Bought by
Siefer Terri L and Siefer John M
Purchase Details
Closed on
Sep 20, 2021
Sold by
Estate Of Mary Lou Siefer
Bought by
Siefer Tern L and Siefer John M
Purchase Details
Closed on
Feb 16, 2010
Sold by
Estate Of John M Siefer
Bought by
Siefer Mary Lou
Purchase Details
Closed on
Oct 14, 1988
Bought by
Siefer John M
Create a Home Valuation Report for This Property
The Home Valuation Report is an in-depth analysis detailing your home's value as well as a comparison with similar homes in the area
Home Values in the Area
Average Home Value in this Area
Purchase History
| Date | Buyer | Sale Price | Title Company |
|---|---|---|---|
| Atherton Mykenzie | $215,000 | None Listed On Document | |
| Covenant Properties And Investments Llc | $125,000 | None Listed On Document | |
| Siefer Terri L | -- | Diamond Title | |
| Siefer Tern L | -- | None Available | |
| Siefer Mary Lou | -- | None Available | |
| Siefer John M | -- | -- |
Source: Public Records
Mortgage History
| Date | Status | Borrower | Loan Amount |
|---|---|---|---|
| Open | Atherton Mykenzie | $188,500 | |
| Previous Owner | Covenant Properties And Investments Llc | $131,250 |
Source: Public Records
Tax History Compared to Growth
Tax History
| Year | Tax Paid | Tax Assessment Tax Assessment Total Assessment is a certain percentage of the fair market value that is determined by local assessors to be the total taxable value of land and additions on the property. | Land | Improvement |
|---|---|---|---|---|
| 2024 | $2,421 | $52,640 | $10,850 | $41,790 |
| 2023 | $2,445 | $43,120 | $10,850 | $32,270 |
| 2022 | $2,477 | $43,120 | $10,850 | $32,270 |
| 2021 | $2,448 | $43,120 | $10,850 | $32,270 |
| 2020 | $2,308 | $36,260 | $10,850 | $25,410 |
| 2019 | $2,309 | $36,260 | $10,850 | $25,410 |
| 2018 | $2,214 | $32,170 | $11,380 | $20,790 |
| 2017 | $2,214 | $32,170 | $11,380 | $20,790 |
| 2016 | $2,209 | $32,170 | $11,380 | $20,790 |
| 2015 | $2,210 | $32,170 | $11,380 | $20,790 |
| 2014 | $2,247 | $32,170 | $11,380 | $20,790 |
| 2013 | $2,231 | $32,170 | $11,380 | $20,790 |
Source: Public Records
Map
Nearby Homes
- 468 Carthage Ave
- 456 Carthage Ave
- 452 Carthage Ave
- 442 Carthage Ave
- 480 Carthage Ave
- 457 Carthage Ave
- 469 Carthage Ave
- 443 Carthage Ave
- 451 Carthage Ave
- 465 Stinaff St
- 459 Stinaff St
- 471 Stinaff St
- 436 Carthage Ave
- 453 Stinaff St
- 490 Carthage Ave
- 479 Stinaff St
- 475 Carthage Ave
- 447 Stinaff St
- 485 Stinaff St
- 485 Carthage Ave