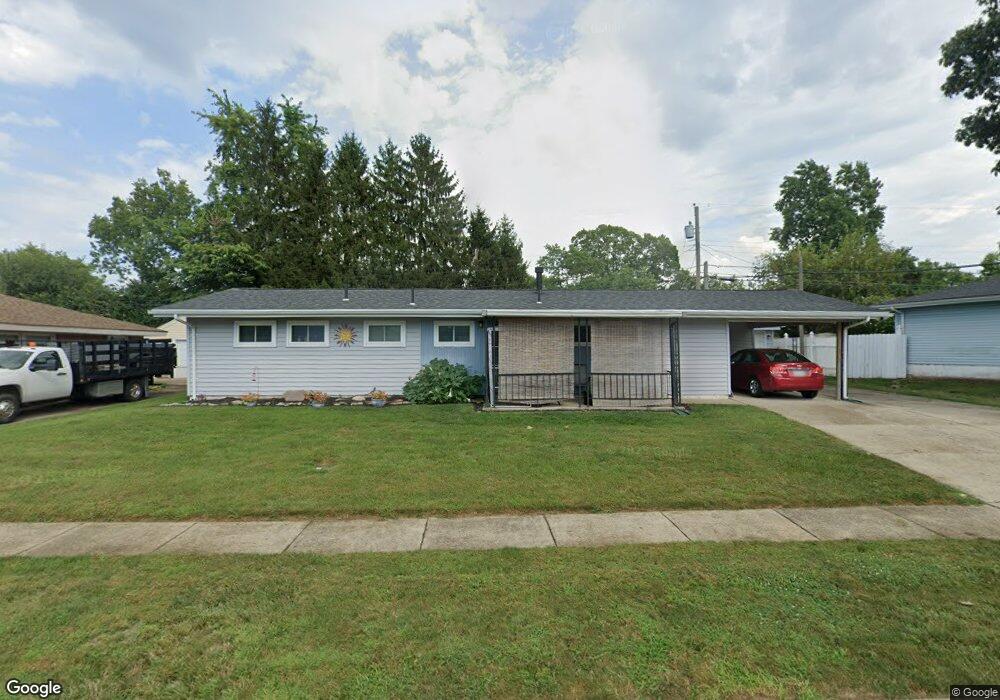
462 Chaucer Rd Dayton, OH 45431
Estimated Value: $174,000 - $213,000
3
Beds
2
Baths
1,803
Sq Ft
$111/Sq Ft
Est. Value
About This Home
This home is located at 462 Chaucer Rd, Dayton, OH 45431 and is currently estimated at $200,520, approximately $111 per square foot. 462 Chaucer Rd is a home located in Montgomery County with nearby schools including Stebbins High School, St. Helen Elementary School, and East Dayton Christian School.
Ownership History
Date
Name
Owned For
Owner Type
Purchase Details
Closed on
Nov 10, 2004
Sold by
Savage Gregory A
Bought by
White Michael J and White Beverly G
Current Estimated Value
Home Financials for this Owner
Home Financials are based on the most recent Mortgage that was taken out on this home.
Original Mortgage
$74,600
Interest Rate
5.91%
Mortgage Type
Fannie Mae Freddie Mac
Purchase Details
Closed on
Jun 17, 2004
Sold by
Magreevy Robert K and Magreevy Edna
Bought by
Savage Gregory A
Home Financials for this Owner
Home Financials are based on the most recent Mortgage that was taken out on this home.
Original Mortgage
$65,000
Interest Rate
6.37%
Mortgage Type
Purchase Money Mortgage
Create a Home Valuation Report for This Property
The Home Valuation Report is an in-depth analysis detailing your home's value as well as a comparison with similar homes in the area
Home Values in the Area
Average Home Value in this Area
Purchase History
| Date | Buyer | Sale Price | Title Company |
|---|---|---|---|
| White Michael J | $93,300 | None Available | |
| Savage Gregory A | $65,000 | -- |
Source: Public Records
Mortgage History
| Date | Status | Borrower | Loan Amount |
|---|---|---|---|
| Previous Owner | White Michael J | $12,300 | |
| Previous Owner | White Michael J | $74,600 | |
| Previous Owner | Savage Gregory A | $65,000 | |
| Previous Owner | Magreevy Robert K | $25,000 |
Source: Public Records
Tax History Compared to Growth
Tax History
| Year | Tax Paid | Tax Assessment Tax Assessment Total Assessment is a certain percentage of the fair market value that is determined by local assessors to be the total taxable value of land and additions on the property. | Land | Improvement |
|---|---|---|---|---|
| 2024 | $1,966 | $49,890 | $8,030 | $41,860 |
| 2023 | $1,966 | $49,890 | $8,030 | $41,860 |
| 2022 | $1,552 | $32,610 | $5,250 | $27,360 |
| 2021 | $1,581 | $32,610 | $5,250 | $27,360 |
| 2020 | $1,579 | $32,610 | $5,250 | $27,360 |
| 2019 | $1,491 | $28,810 | $5,670 | $23,140 |
| 2018 | $1,494 | $28,810 | $5,670 | $23,140 |
| 2017 | $1,494 | $28,810 | $5,670 | $23,140 |
| 2016 | $1,421 | $27,230 | $5,250 | $21,980 |
| 2015 | $2,192 | $27,230 | $5,250 | $21,980 |
| 2014 | $2,192 | $27,230 | $5,250 | $21,980 |
| 2012 | -- | $30,680 | $7,700 | $22,980 |
Source: Public Records
Map
Nearby Homes
- 551 Ketcham St
- 5234 Flamingo Ct
- 283 Spinning Rd
- 329 Lawver Ln
- 785 Biltmore Place
- 2332 Bonnieview Ave
- 145 Meyer Ave
- 625 Fulmer Dr
- 456 S Hayden Ave
- 421 Alexander Dr
- 511 S Hayden Ave
- 4311 Richland Ave
- 719 Cosler Dr
- 992 Spinning Rd
- 4328 Richland Ave
- 1105 Ames Ave
- 1809 Darst Ave
- 1815 Huffman Ave
- 1800 Darst Ave
- 1301 Ames Ave
- 450 Chaucer Rd
- 474 Chaucer Rd
- 463 Pardee Place
- 453 Pardee Place
- 465 Chaucer Rd
- 5193 Fredonia Ave
- 443 Pardee Place
- 453 Chaucer Rd
- 438 Chaucer Rd
- 475 Chaucer Rd
- 441 Chaucer Rd
- 433 Pardee Place
- 426 Chaucer Rd
- 464 Darnell Dr
- 454 Darnell Dr
- 460 Pardee Place
- 498 Chaucer Rd
- 450 Pardee Place
- 5125 Fredonia Ave
- 5190 Fredonia Ave