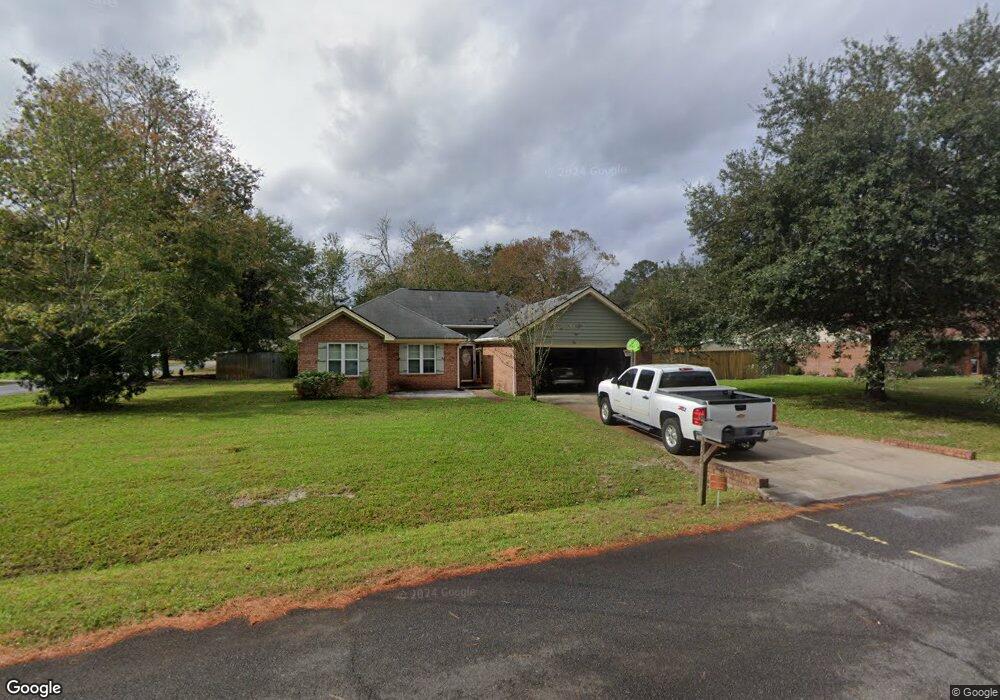
462 Floyd Cir Hinesville, GA 31313
Estimated Value: $253,000 - $269,000
3
Beds
2
Baths
1,627
Sq Ft
$160/Sq Ft
Est. Value
About This Home
This home is located at 462 Floyd Cir, Hinesville, GA 31313 and is currently estimated at $260,096, approximately $159 per square foot. 462 Floyd Cir is a home located in Liberty County with nearby schools including Joseph Martin Elementary School, Snelson-Golden Middle School, and Liberty County High School.
Ownership History
Date
Name
Owned For
Owner Type
Purchase Details
Closed on
Jul 12, 2012
Sold by
Nelson Christian
Bought by
Troha Sarah L
Current Estimated Value
Home Financials for this Owner
Home Financials are based on the most recent Mortgage that was taken out on this home.
Original Mortgage
$119,920
Outstanding Balance
$82,975
Interest Rate
3.72%
Mortgage Type
New Conventional
Estimated Equity
$177,121
Purchase Details
Closed on
Jun 30, 2009
Sold by
Butler Karen L
Bought by
Nelson Christian
Home Financials for this Owner
Home Financials are based on the most recent Mortgage that was taken out on this home.
Original Mortgage
$126,800
Interest Rate
4.12%
Mortgage Type
New Conventional
Purchase Details
Closed on
Feb 5, 2001
Sold by
Shaner Edward and Shaner Juli
Bought by
Butler Karen L and Butler Kevin A
Purchase Details
Closed on
Dec 30, 1996
Sold by
Crosson Hugh and Crosson M
Bought by
Shaner Edward and Shaner Juli
Purchase Details
Closed on
May 16, 1991
Bought by
Crosson Hugh and Crosson M
Create a Home Valuation Report for This Property
The Home Valuation Report is an in-depth analysis detailing your home's value as well as a comparison with similar homes in the area
Home Values in the Area
Average Home Value in this Area
Purchase History
| Date | Buyer | Sale Price | Title Company |
|---|---|---|---|
| Troha Sarah L | $149,900 | -- | |
| Nelson Christian | $158,500 | -- | |
| Butler Karen L | $97,900 | -- | |
| Shaner Edward | $94,000 | -- | |
| Crosson Hugh | $84,500 | -- |
Source: Public Records
Mortgage History
| Date | Status | Borrower | Loan Amount |
|---|---|---|---|
| Open | Troha Sarah L | $119,920 | |
| Previous Owner | Nelson Christian | $126,800 |
Source: Public Records
Tax History Compared to Growth
Tax History
| Year | Tax Paid | Tax Assessment Tax Assessment Total Assessment is a certain percentage of the fair market value that is determined by local assessors to be the total taxable value of land and additions on the property. | Land | Improvement |
|---|---|---|---|---|
| 2024 | $2,959 | $82,739 | $16,000 | $66,739 |
| 2023 | $2,959 | $78,026 | $14,000 | $64,026 |
| 2022 | $2,534 | $66,666 | $14,000 | $52,666 |
| 2021 | $2,399 | $55,083 | $11,200 | $43,883 |
| 2020 | $2,378 | $53,647 | $11,200 | $42,447 |
| 2019 | $2,306 | $52,586 | $9,600 | $42,986 |
| 2018 | $2,265 | $53,125 | $9,600 | $43,525 |
| 2017 | $1,767 | $53,664 | $9,600 | $44,064 |
| 2016 | $2,099 | $52,101 | $9,600 | $42,501 |
| 2015 | $2,508 | $44,356 | $9,600 | $34,756 |
| 2014 | $2,508 | $55,076 | $10,400 | $44,676 |
| 2013 | -- | $59,554 | $10,400 | $49,154 |
Source: Public Records
Map
Nearby Homes
- 0 E General Stewart Way
- 0 General Stewart Way
- 411 Woodland Dr
- 24 Sherwood Dr
- 205 Wilson Ave
- 301 Lakeview Dr
- 108 W General Stewart Way
- 173 Ironwood Dr
- 830 Bradwell St
- 103 Stewart Terrace
- 812 Spanish Oak Dr
- 604 Caroline St
- 822 Lakeview Ct
- 1.76 AC Tranquill Way
- 1.76 AC Shyam Dr
- 4 Lots Memorial Dr
- 1 Oglethorpe Ave
- 804 Barrington Dr
- 996 Stone Ct
- 910 Kings Rd
- 456 Floyd Cir
- 402 Floyd Cir
- 0 Floyd Cir Unit 8257123
- 0 Floyd Cir Unit 8058971
- 0 Floyd Cir Unit 7075469
- 0 Floyd Cir Unit 3239245
- 0 Floyd Cir
- 406 Floyd St
- 704 Marlborough Ct
- 457 Floyd Cir
- 413 Floyd Cir
- 408 Floyd St
- 408 Floyd Cir
- 402 Floyd St
- 447 Floyd Cir
- 310 Floyd St
- 706 Marlborough Ct Unit 33
- 706 Marlborough Ct Unit n/a
- 706 Marlborough Ct
- 414 Floyd Cir