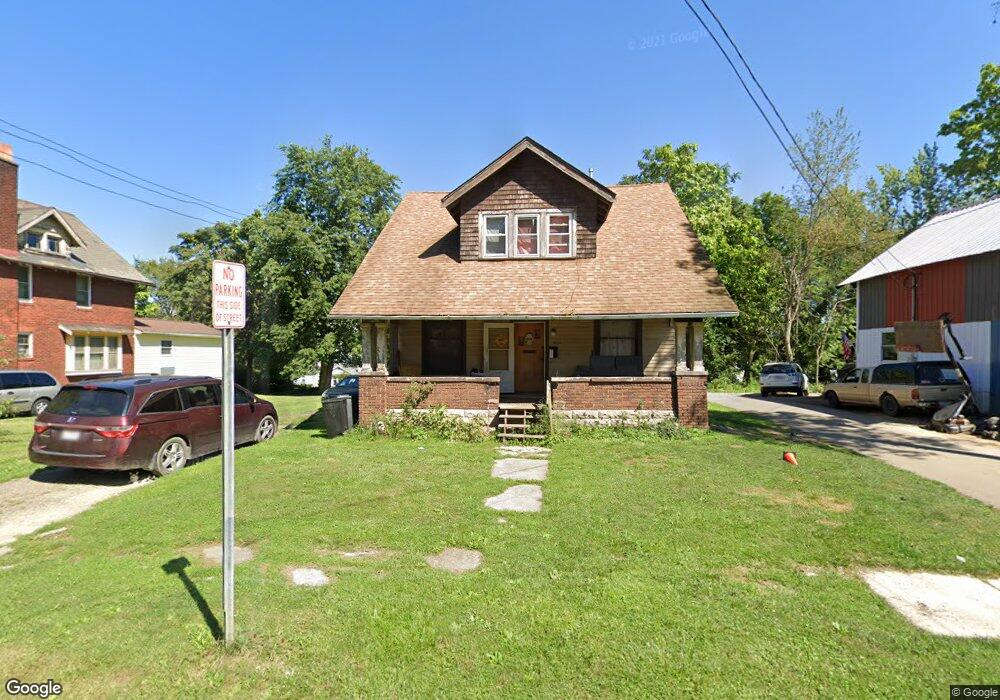
462 N Mulberry St Mansfield, OH 44902
Estimated Value: $88,953 - $142,000
4
Beds
2
Baths
1,806
Sq Ft
$60/Sq Ft
Est. Value
About This Home
This home is located at 462 N Mulberry St, Mansfield, OH 44902 and is currently estimated at $109,238, approximately $60 per square foot. 462 N Mulberry St is a home located in Richland County with nearby schools including Goal Digital Academy, St. Peter's Elementary/Montessori School, and St. Peter's High School/Junior High.
Ownership History
Date
Name
Owned For
Owner Type
Purchase Details
Closed on
Feb 2, 2021
Sold by
Covault Rodney H and Covault Amanda L
Bought by
Covault Krissy
Current Estimated Value
Purchase Details
Closed on
Mar 7, 2011
Sold by
Lykins Jody R and Lykins Pamela L
Bought by
Covault Rodney H and Covault Amanda L
Purchase Details
Closed on
Jul 10, 2006
Sold by
Miller Douglas B
Bought by
Washington Mutual Bank Fa
Purchase Details
Closed on
Dec 2, 2004
Sold by
Sharrock David R and Sharrock Doris A
Bought by
Miller Douglas B and Miller Jan
Home Financials for this Owner
Home Financials are based on the most recent Mortgage that was taken out on this home.
Original Mortgage
$40,410
Interest Rate
5.82%
Mortgage Type
Purchase Money Mortgage
Purchase Details
Closed on
Sep 17, 2003
Sold by
Mcduffie Karen and Mcduffie Ronald
Bought by
Sharrock David R and Sharrock Doris A
Purchase Details
Closed on
Oct 1, 2002
Sold by
Estate Of Israel Mcduffie
Bought by
Mcduffie Karen and Mcduffie Ronald
Create a Home Valuation Report for This Property
The Home Valuation Report is an in-depth analysis detailing your home's value as well as a comparison with similar homes in the area
Home Values in the Area
Average Home Value in this Area
Purchase History
| Date | Buyer | Sale Price | Title Company |
|---|---|---|---|
| Covault Krissy | -- | None Available | |
| Covault Rodney H | $10,000 | Attorney | |
| Washington Mutual Bank Fa | $37,660 | None Available | |
| Miller Douglas B | $44,900 | Southern Title | |
| Sharrock David R | $15,000 | Acs Title | |
| Mcduffie Karen | -- | -- |
Source: Public Records
Mortgage History
| Date | Status | Borrower | Loan Amount |
|---|---|---|---|
| Previous Owner | Miller Douglas B | $40,410 |
Source: Public Records
Tax History Compared to Growth
Tax History
| Year | Tax Paid | Tax Assessment Tax Assessment Total Assessment is a certain percentage of the fair market value that is determined by local assessors to be the total taxable value of land and additions on the property. | Land | Improvement |
|---|---|---|---|---|
| 2024 | $798 | $17,030 | $2,160 | $14,870 |
| 2023 | $798 | $17,030 | $2,160 | $14,870 |
| 2022 | $727 | $12,990 | $1,960 | $11,030 |
| 2021 | $732 | $12,990 | $1,960 | $11,030 |
| 2020 | $748 | $12,990 | $1,960 | $11,030 |
| 2019 | $829 | $12,990 | $1,960 | $11,030 |
| 2018 | $818 | $12,990 | $1,960 | $11,030 |
| 2017 | $795 | $12,990 | $1,960 | $11,030 |
| 2016 | $795 | $12,590 | $2,080 | $10,510 |
| 2015 | $795 | $12,590 | $2,080 | $10,510 |
| 2014 | $749 | $12,590 | $2,080 | $10,510 |
| 2012 | $601 | $13,250 | $2,180 | $11,070 |
Source: Public Records
Map
Nearby Homes
- 156 Buckingham Ave Unit 158
- 452 Daisy St
- 526 Bowman St
- 371 Bell St
- 283 Bulkley Ave
- 0 Voegele Ave Unit Lot 6048, 6049, 6
- 426 Mcpherson St
- 743 Bowman St
- 169 W 5th St
- 219 W 5th St
- 362-364 W 6th St
- 282 W 5th St
- 346 Newman St
- 458 Wayne St
- 512 Burns St
- 0 Highway 30
- 311 Auburn St
- 82 N Adams St
- 406 Sherman Place
- 120 Gettings Place
- 466 N Mulberry St
- 458 N Mulberry St
- 468 N Mulberry St
- 470 N Mulberry St
- 0 N Mulberry St
- 472 N Mulberry St
- 455 Daisy St
- 445 Daisy St
- 107 Harker St
- 439 Daisy St
- 463 N Mulberry St
- 467 N Mulberry St
- 463 Daisy St
- 451 Daisy St
- 459 Daisy St
- 475 N Mulberry St
- 479 N Mulberry St
- 473 Daisy St
- 138 Buckingham Ave
- 144 Buckingham Ave