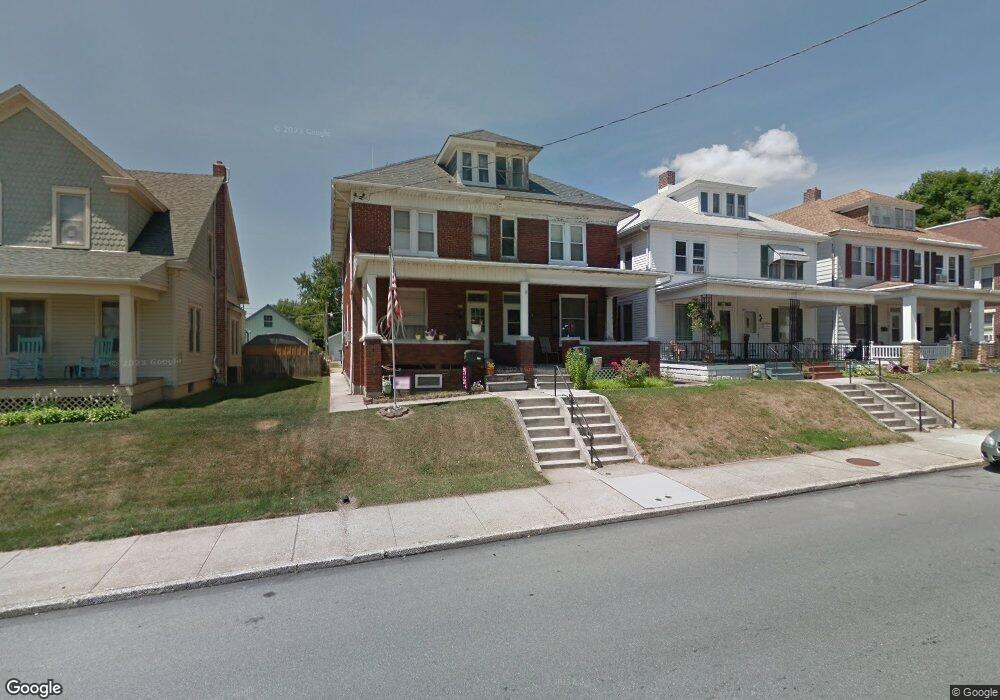
462 S Main St Red Lion, PA 17356
Estimated Value: $146,000 - $200,000
3
Beds
2
Baths
1,374
Sq Ft
$131/Sq Ft
Est. Value
About This Home
This home is located at 462 S Main St, Red Lion, PA 17356 and is currently estimated at $180,088, approximately $131 per square foot. 462 S Main St is a home located in York County with nearby schools including Pleasant View Elementary School, Red Lion Area Junior High School, and Red Lion Area Senior High School.
Ownership History
Date
Name
Owned For
Owner Type
Purchase Details
Closed on
Oct 15, 2010
Sold by
Deutsche Bank National Trust Company
Bought by
Sowards Kyle and Sowards Caitlin J
Current Estimated Value
Home Financials for this Owner
Home Financials are based on the most recent Mortgage that was taken out on this home.
Original Mortgage
$71,501
Interest Rate
4.24%
Mortgage Type
New Conventional
Purchase Details
Closed on
Jul 28, 2010
Sold by
Centineo Timothy P and Centineo Sharon E
Bought by
Deutsche Bank National Trust Company
Purchase Details
Closed on
Nov 30, 2006
Sold by
Miller William F and Miller Patty E
Bought by
Centineo Timothy P and Centineo Sharon E
Home Financials for this Owner
Home Financials are based on the most recent Mortgage that was taken out on this home.
Original Mortgage
$100,720
Interest Rate
6.29%
Mortgage Type
Purchase Money Mortgage
Create a Home Valuation Report for This Property
The Home Valuation Report is an in-depth analysis detailing your home's value as well as a comparison with similar homes in the area
Home Values in the Area
Average Home Value in this Area
Purchase History
| Date | Buyer | Sale Price | Title Company |
|---|---|---|---|
| Sowards Kyle | $69,000 | None Available | |
| Deutsche Bank National Trust Company | $2,417 | None Available | |
| Centineo Timothy P | $125,900 | None Available |
Source: Public Records
Mortgage History
| Date | Status | Borrower | Loan Amount |
|---|---|---|---|
| Previous Owner | Sowards Kyle | $71,501 | |
| Previous Owner | Centineo Timothy P | $100,720 |
Source: Public Records
Tax History Compared to Growth
Tax History
| Year | Tax Paid | Tax Assessment Tax Assessment Total Assessment is a certain percentage of the fair market value that is determined by local assessors to be the total taxable value of land and additions on the property. | Land | Improvement |
|---|---|---|---|---|
| 2025 | $2,688 | $77,780 | $23,940 | $53,840 |
| 2024 | $2,581 | $77,780 | $23,940 | $53,840 |
| 2023 | $2,581 | $77,780 | $23,940 | $53,840 |
| 2022 | $2,581 | $77,780 | $23,940 | $53,840 |
| 2021 | $2,518 | $77,780 | $23,940 | $53,840 |
| 2020 | $2,518 | $77,780 | $23,940 | $53,840 |
| 2019 | $2,511 | $77,780 | $23,940 | $53,840 |
| 2018 | $2,511 | $77,780 | $23,940 | $53,840 |
| 2017 | $2,511 | $77,780 | $23,940 | $53,840 |
| 2016 | $0 | $77,780 | $23,940 | $53,840 |
| 2015 | -- | $77,780 | $23,940 | $53,840 |
| 2014 | -- | $77,780 | $23,940 | $53,840 |
Source: Public Records
Map
Nearby Homes
- 645 S Main St
- 202 S Main St
- 738 Wise Ave
- 157 E Broadway
- 314 Boundary Ave
- 520 E Lancaster St
- 28 Pleasant Ave
- 79 1st Ave
- 81 1st Ave Unit E
- 116 S Franklin St
- 503 W Broadway
- 340 S Camp St
- 118 Keener Ave
- 209 Forest Hills Rd
- 217 N Charles St
- 620 Boundary Ave
- 270 N Main St
- 850 Jefferson Ln
- 495 Thomas Armor Dr
- 400 Carriage Ln Unit 400