Estimated Value: $25,694 - $230,000
3
Beds
2
Baths
1,064
Sq Ft
$146/Sq Ft
Est. Value
About This Home
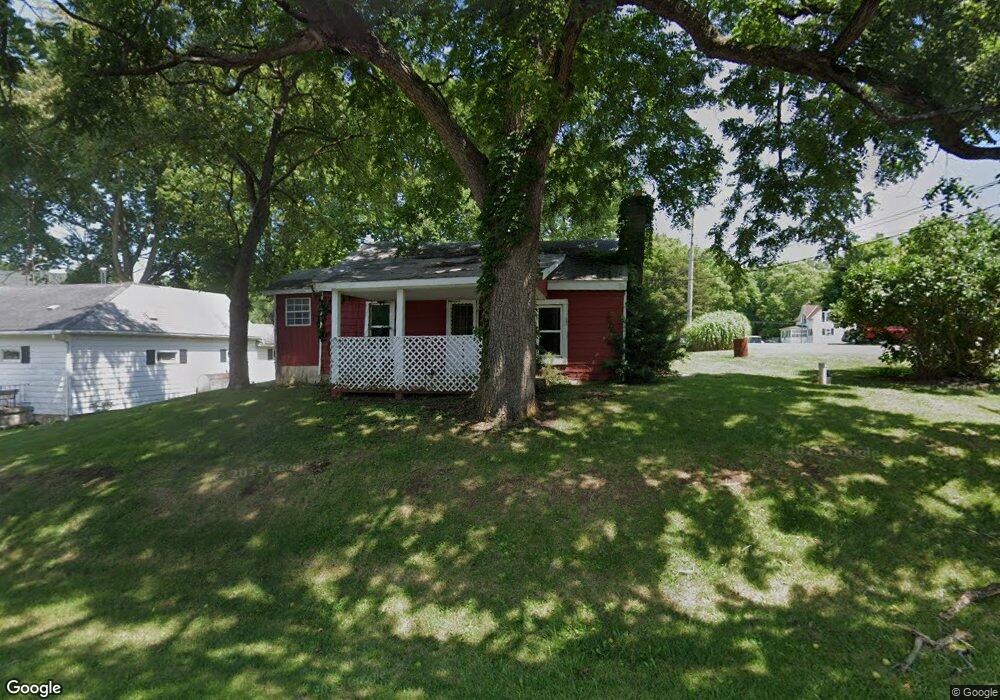
This home is located at 462 Towpath Trail, Piqua, OH 45356 and is currently estimated at $155,674, approximately $146 per square foot. 462 Towpath Trail is a home located in Shelby County with nearby schools including Hardin Houston Elementary School and Houston High School.
Ownership History
Date
Name
Owned For
Owner Type
Purchase Details
Closed on
Oct 18, 2016
Sold by
Brelsford Randall W and Brelsford Mary A
Bought by
Rm Brelsford Rentals Llc
Current Estimated Value
Purchase Details
Closed on
Dec 29, 2015
Sold by
Sowers Michael P
Bought by
Brelsford Randall W and Brelsford Mary A
Purchase Details
Closed on
Jun 27, 2015
Sold by
Smith David A and Rice Shannon M
Bought by
Sowers Michael P
Purchase Details
Closed on
Jun 1, 2015
Sold by
Middleton Seth and Middleton Britnie
Bought by
Mchone Charlses
Purchase Details
Closed on
May 27, 2015
Sold by
Mchone Charles and Mchone Sharon
Bought by
Smith David A and Rice Shannon M
Purchase Details
Closed on
Oct 4, 2006
Sold by
Mcneil Lucy Ann and Freeman Judy
Bought by
Middleton Seth
Purchase Details
Closed on
Feb 4, 2005
Sold by
Estate Of Elmer G Mcneil
Bought by
Mcneil Lucy Ann
Create a Home Valuation Report for This Property
The Home Valuation Report is an in-depth analysis detailing your home's value as well as a comparison with similar homes in the area
Purchase History
| Date | Buyer | Sale Price | Title Company |
|---|---|---|---|
| Rm Brelsford Rentals Llc | -- | None Available | |
| Brelsford Randall W | $12,000 | Attorney | |
| Sowers Michael P | $15,000 | None Available | |
| Mchone Charlses | -- | Attorney | |
| Smith David A | $15,000 | Attorney | |
| Middleton Seth | $21,000 | None Available | |
| Mcneil Lucy Ann | -- | None Available |
Source: Public Records
Tax History
| Year | Tax Paid | Tax Assessment Tax Assessment Total Assessment is a certain percentage of the fair market value that is determined by local assessors to be the total taxable value of land and additions on the property. | Land | Improvement |
|---|---|---|---|---|
| 2024 | $697 | $20,000 | $3,070 | $16,930 |
| 2023 | $726 | $20,000 | $3,070 | $16,930 |
| 2022 | $549 | $12,250 | $2,310 | $9,940 |
| 2021 | $554 | $12,250 | $2,310 | $9,940 |
| 2020 | $529 | $12,250 | $2,310 | $9,940 |
| 2019 | $467 | $10,500 | $1,920 | $8,580 |
| 2018 | $622 | $14,660 | $1,920 | $12,740 |
| 2017 | $625 | $14,660 | $1,920 | $12,740 |
| 2016 | $258 | $6,270 | $1,920 | $4,350 |
| 2015 | $259 | $6,270 | $1,920 | $4,350 |
| 2014 | $246 | $5,960 | $1,920 | $4,040 |
| 2013 | $259 | $5,880 | $1,920 | $3,960 |
Source: Public Records
Map
Nearby Homes
- 10040 Kaser Rd
- 10807 Lock Ln
- 10909 Lock Ln
- 2341 Miami Conservancy Rd
- 9907 Barnum Rd
- 9825 Augusta Ln
- 9843 Barnum Rd
- 665 W Geiserman Rd
- 9606 Piqua Lockington Rd
- 1735 Stockham Dr
- 9480 Meckstroth Dr
- 10175 N Piqua-Lockington Rd
- 2345 Pickawillany Way
- 2332 Kiowa Ct
- 3005 Seminole Way
- 00 N Co Road 25a
- 00 N County Road 25a
- 10843 Mohawk Ct
- 3220 Cherokee Dr
- 10175 Piqua Lockington Rd
- 470 Towpath Trail
- 10346 White Horse Trail
- 463 Tow Path Trail
- 463 Towpath Trail
- 479 Cross Trail
- 461 Cross Trail
- 10321 White Horse Trail
- 499 Cross Trail
- 447 Towpath Trail
- 447 Tow Path Trail
- 10310 Seminole Trail
- 10404 Seminole Trail
- 466 Cross Trail
- 10391 White Horse Trail
- 10387 Seminole Trail
- 10474 White Horse Trail
- 10499 White Horse Trail
- 10499 White Horse Trail
- 10319 Black Fox Trail
- 10439 Seminole Trail
Your Personal Tour Guide
Ask me questions while you tour the home.