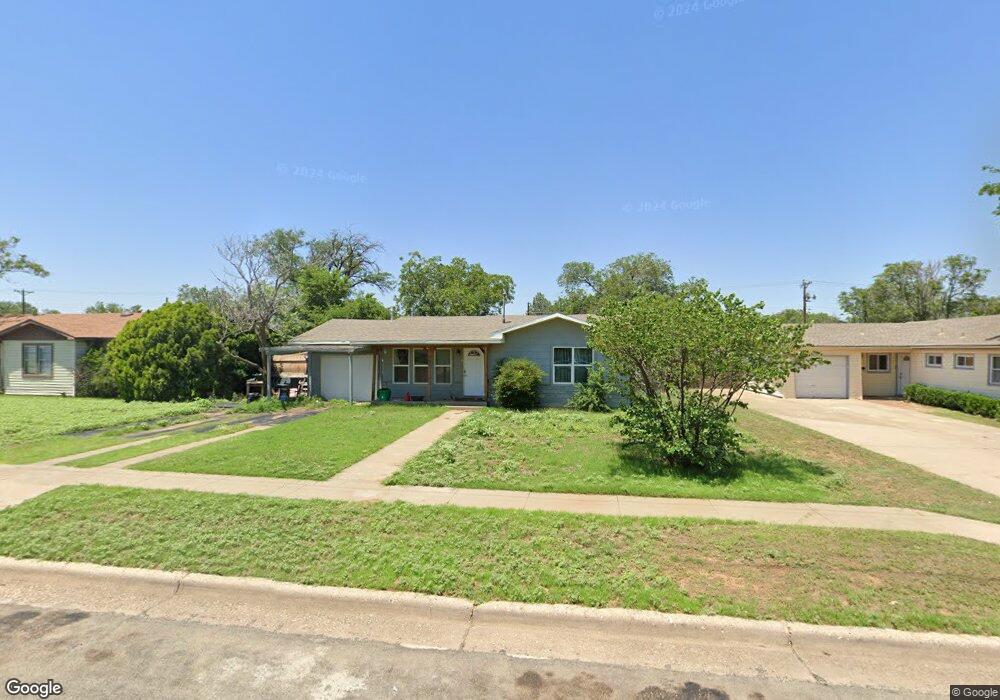
4620 42nd St Lubbock, TX 79414
Stubbs-Stewart NeighborhoodEstimated Value: $90,000 - $118,035
2
Beds
1
Bath
972
Sq Ft
$112/Sq Ft
Est. Value
About This Home
This home is located at 4620 42nd St, Lubbock, TX 79414 and is currently estimated at $108,509, approximately $111 per square foot. 4620 42nd St is a home located in Lubbock County with nearby schools including Stewart Elementary School, Commander William C. McCool Academy, and Irons Middle School.
Ownership History
Date
Name
Owned For
Owner Type
Purchase Details
Closed on
Jun 27, 2024
Sold by
Butts Mary
Bought by
Butts Mandi Marie
Current Estimated Value
Purchase Details
Closed on
Jan 22, 2013
Sold by
Merbach Catherine
Bought by
Score Builders Inc
Purchase Details
Closed on
Oct 1, 2004
Sold by
Wines Weldon L
Bought by
Score Builders Inc
Purchase Details
Closed on
Oct 12, 2000
Sold by
Kelley Roy A Mrs
Bought by
Score Builders Inc
Create a Home Valuation Report for This Property
The Home Valuation Report is an in-depth analysis detailing your home's value as well as a comparison with similar homes in the area
Home Values in the Area
Average Home Value in this Area
Purchase History
| Date | Buyer | Sale Price | Title Company |
|---|---|---|---|
| Butts Mandi Marie | -- | None Listed On Document | |
| Score Builders Inc | -- | None Available | |
| Score Builders Inc | -- | -- | |
| Score Builders Inc | -- | -- |
Source: Public Records
Tax History Compared to Growth
Tax History
| Year | Tax Paid | Tax Assessment Tax Assessment Total Assessment is a certain percentage of the fair market value that is determined by local assessors to be the total taxable value of land and additions on the property. | Land | Improvement |
|---|---|---|---|---|
| 2025 | $1,412 | $90,000 | $25,000 | $65,000 |
| 2024 | $1,412 | $113,230 | $25,000 | $88,230 |
| 2023 | $1,300 | $97,024 | $8,382 | $95,750 |
| 2022 | $1,810 | $89,429 | $8,382 | $81,211 |
| 2021 | $1,741 | $81,299 | $8,382 | $72,917 |
| 2020 | $1,609 | $74,008 | $8,382 | $65,626 |
| 2019 | $1,354 | $60,335 | $8,382 | $51,953 |
| 2018 | $1,479 | $65,805 | $8,382 | $57,423 |
| 2017 | $1,481 | $65,805 | $8,382 | $57,423 |
| 2016 | $1,300 | $57,749 | $8,382 | $49,367 |
| 2015 | $1,240 | $57,749 | $8,382 | $49,367 |
| 2014 | $1,240 | $55,755 | $4,290 | $51,465 |
Source: Public Records
Map
Nearby Homes