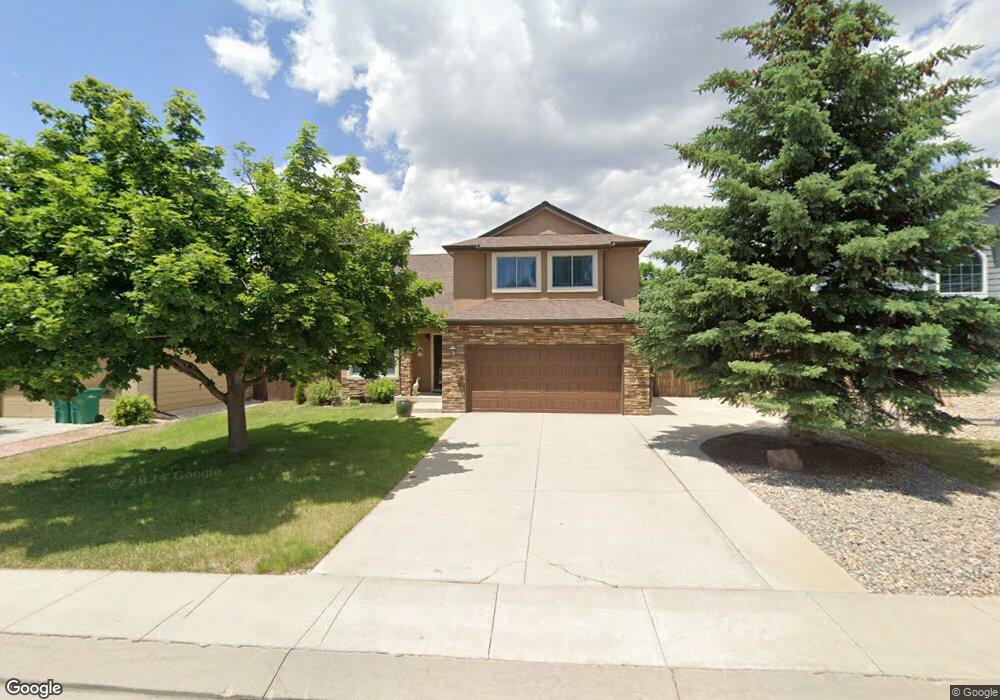
4620 Lasater Trail Colorado Springs, CO 80922
Springs Ranch NeighborhoodEstimated Value: $449,430 - $498,000
4
Beds
4
Baths
1,773
Sq Ft
$271/Sq Ft
Est. Value
About This Home
This home is located at 4620 Lasater Trail, Colorado Springs, CO 80922 and is currently estimated at $480,858, approximately $271 per square foot. 4620 Lasater Trail is a home located in El Paso County with nearby schools including Springs Ranch Elementary School, Horizon Middle School, and Sand Creek High School.
Ownership History
Date
Name
Owned For
Owner Type
Purchase Details
Closed on
Dec 27, 1995
Sold by
Livengood Gary W and Livengood Deanna L
Bought by
Arrington David R and Arrington Donna Marie A
Current Estimated Value
Home Financials for this Owner
Home Financials are based on the most recent Mortgage that was taken out on this home.
Original Mortgage
$119,900
Outstanding Balance
$3,251
Interest Rate
7.34%
Estimated Equity
$477,607
Purchase Details
Closed on
Feb 28, 1994
Sold by
Richmond Homes Inc Ii
Bought by
Livengood Gary W and Livengood Deanna L
Home Financials for this Owner
Home Financials are based on the most recent Mortgage that was taken out on this home.
Original Mortgage
$132,091
Interest Rate
7%
Mortgage Type
VA
Purchase Details
Closed on
Sep 9, 1993
Bought by
Arrington David R and Arrington Donnamarie A
Purchase Details
Closed on
Jun 18, 1993
Bought by
Arrington David R and Arrington Donnamarie A
Create a Home Valuation Report for This Property
The Home Valuation Report is an in-depth analysis detailing your home's value as well as a comparison with similar homes in the area
Home Values in the Area
Average Home Value in this Area
Purchase History
| Date | Buyer | Sale Price | Title Company |
|---|---|---|---|
| Arrington David R | $149,900 | Security Title | |
| Livengood Gary W | $129,501 | Land Title | |
| Arrington David R | $139,500 | -- | |
| Arrington David R | -- | -- |
Source: Public Records
Mortgage History
| Date | Status | Borrower | Loan Amount |
|---|---|---|---|
| Open | Arrington David R | $119,900 | |
| Previous Owner | Livengood Gary W | $132,091 |
Source: Public Records
Tax History Compared to Growth
Tax History
| Year | Tax Paid | Tax Assessment Tax Assessment Total Assessment is a certain percentage of the fair market value that is determined by local assessors to be the total taxable value of land and additions on the property. | Land | Improvement |
|---|---|---|---|---|
| 2025 | $1,805 | $32,400 | -- | -- |
| 2024 | $1,705 | $32,350 | $4,620 | $27,730 |
| 2023 | $1,705 | $32,350 | $4,620 | $27,730 |
| 2022 | $1,440 | $23,170 | $4,170 | $19,000 |
| 2021 | $1,499 | $23,830 | $4,290 | $19,540 |
| 2020 | $1,311 | $20,600 | $3,580 | $17,020 |
| 2019 | $1,298 | $20,600 | $3,580 | $17,020 |
| 2018 | $1,104 | $17,190 | $3,020 | $14,170 |
| 2017 | $1,109 | $17,190 | $3,020 | $14,170 |
| 2016 | $1,116 | $17,070 | $2,950 | $14,120 |
| 2015 | $1,117 | $17,070 | $2,950 | $14,120 |
| 2014 | $1,041 | $15,610 | $2,790 | $12,820 |
Source: Public Records
Map
Nearby Homes
- 6980 Ashley Dr
- 6835 Ashley Dr
- 7004 Ash Creek Heights Unit 201
- 6984 Ash Creek Heights Unit 204
- 6615 Annanhill Place
- 7084 Ash Creek Heights Unit 201
- 7104 Ash Creek Heights Unit 203
- 4611 Hotspur Dr
- 5914 Instone Cir
- 4354 Round Hill Dr
- 4457 Centerville Dr
- 5934 Instone Cir
- 7020 Hillbeck Dr
- 7010 Highcroft Dr
- 4489 Crow Creek Dr
- 4690 Badlands Ct
- 6180 Kettle Ct
- 4632 Hidden River Dr
- 4034 Ryedale Way
- 6330 Emma Ln
- 4630 Lasater Trail
- 4610 Lasater Trail
- 6845 Holt Dr
- 4640 Lasater Trail
- 6855 Holt Dr
- 6835 Holt Dr
- 4580 Lasater Trail
- 6865 Holt Dr
- 6825 Holt Dr
- 4650 Lasater Trail
- 4595 Lasater Trail
- 4585 Lasater Trail
- 4605 Lasater Trail
- 4570 Lasater Trail
- 4575 Lasater Trail
- 6875 Holt Dr
- 6815 Holt Dr
- 4615 Lasater Trail
- 4660 Lasater Trail
- 4565 Lasater Trail