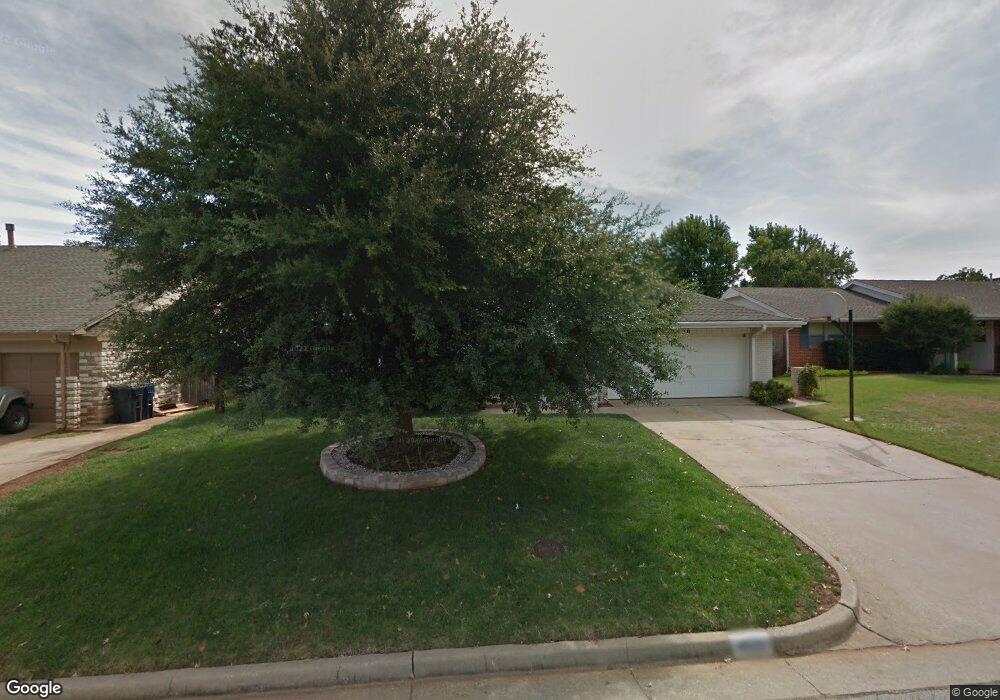
4620 NW 60th St Oklahoma City, OK 73122
Rollingwood NeighborhoodEstimated Value: $180,000 - $204,722
3
Beds
2
Baths
1,589
Sq Ft
$121/Sq Ft
Est. Value
About This Home
This home is located at 4620 NW 60th St, Oklahoma City, OK 73122 and is currently estimated at $192,931, approximately $121 per square foot. 4620 NW 60th St is a home located in Oklahoma County with nearby schools including Rollingwood Elementary School, James L. Capps Middle School, and Putnam City High School.
Ownership History
Date
Name
Owned For
Owner Type
Purchase Details
Closed on
Jul 21, 2017
Sold by
Edison David A and Edison Nancy L
Bought by
Edison Nancy L
Current Estimated Value
Purchase Details
Closed on
Nov 17, 2014
Sold by
Clark Nguyen Diane Louise and Clark Eldon Don
Bought by
Clark Ayare Diane Louise
Purchase Details
Closed on
May 13, 2002
Sold by
Novastar Mtg Inc
Bought by
Clark Don J and Clark Margie L
Purchase Details
Closed on
Feb 19, 2002
Sold by
Sauble David Edward and Case #Cj-2001-8097
Bought by
Novastar Mtg Inc
Purchase Details
Closed on
Aug 19, 1998
Sold by
Sauble Kathy Sue
Bought by
Sauble David Edward
Purchase Details
Closed on
Aug 18, 1998
Sold by
Sauble David Edward
Bought by
Sauble Kathy Sue
Purchase Details
Closed on
Jul 29, 1998
Sold by
Sauble Kathy Sue
Bought by
Sauble David Edward
Purchase Details
Closed on
Nov 26, 1997
Sold by
Sauble David Edward
Bought by
Sauble Kathy Sue
Create a Home Valuation Report for This Property
The Home Valuation Report is an in-depth analysis detailing your home's value as well as a comparison with similar homes in the area
Home Values in the Area
Average Home Value in this Area
Purchase History
| Date | Buyer | Sale Price | Title Company |
|---|---|---|---|
| Edison Nancy L | -- | None Available | |
| Clark Ayare Diane Louise | -- | None Available | |
| Clark Don J | $79,000 | American Guaranty Title Co | |
| Novastar Mtg Inc | -- | Oklahoma City Abstract & Tit | |
| Sauble David Edward | -- | -- | |
| Sauble Kathy Sue | -- | -- | |
| Sauble David Edward | -- | -- | |
| Sauble Kathy Sue | -- | -- |
Source: Public Records
Tax History Compared to Growth
Tax History
| Year | Tax Paid | Tax Assessment Tax Assessment Total Assessment is a certain percentage of the fair market value that is determined by local assessors to be the total taxable value of land and additions on the property. | Land | Improvement |
|---|---|---|---|---|
| 2024 | $2,212 | $19,052 | $3,501 | $15,551 |
| 2023 | $2,212 | $18,145 | $2,448 | $15,697 |
| 2022 | $2,133 | $17,280 | $2,668 | $14,612 |
| 2021 | $2,012 | $16,458 | $2,968 | $13,490 |
| 2020 | $1,907 | $15,675 | $3,005 | $12,670 |
| 2019 | $1,800 | $15,015 | $2,668 | $12,347 |
| 2018 | $1,716 | $14,300 | $0 | $0 |
| 2017 | $1,718 | $14,290 | $2,646 | $11,644 |
| 2016 | $1,634 | $13,610 | $2,652 | $10,958 |
| 2015 | $1,574 | $12,962 | $2,656 | $10,306 |
| 2014 | $1,514 | $12,956 | $2,656 | $10,300 |
Source: Public Records
Map
Nearby Homes
- 4632 NW 60th St
- 4612 NW 62nd St
- 6309 NW 62nd Cir
- 6308 NW 62nd Cir
- 5800 N Meridian Place
- 4401 NW 60th St
- 5714 N Meridian Ave
- 4405 NW 59th St
- 4320 NW 61st Terrace
- 6200 N Warren Ave
- 4412 NW 57th St
- 4312 NW 59th St
- 6425 N Harvard Ave
- 4221 NW 60th Place
- 4312 NW 56th Terrace
- 4333 NW 55th St
- 4219 NW 58th St
- 6554 N Meridian Ave Unit 210
- 4406 NW 54th St
- 6724 N Meridian Ave Unit C
- 4616 NW 60th St
- 4624 NW 60th St
- 4617 NW 59th Terrace
- 4613 NW 59th Terrace
- 4612 NW 60th St
- 4628 NW 60th St
- 4621 NW 59th Terrace
- 4621 NW 60th St
- 4609 NW 59th Terrace
- 4625 NW 60th St
- 4625 NW 59th Terrace
- 4617 NW 60th St
- 4608 NW 60th St
- 4629 NW 60th St
- 4613 NW 60th St
- 4629 NW 59th Terrace
- 4605 NW 59th Terrace
- 4633 NW 60th St
- 4636 NW 60th St
- 4604 NW 60th St