Estimated Value: $337,000 - $352,000
3
Beds
2
Baths
1,143
Sq Ft
$299/Sq Ft
Est. Value
About This Home
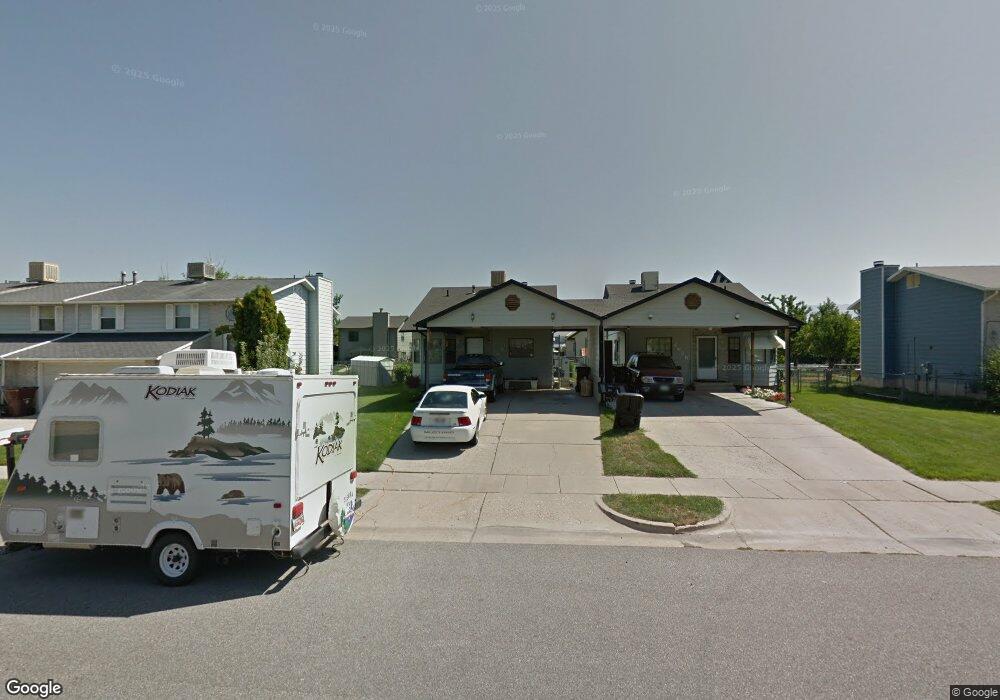
This home is located at 4620 S 3900 W, Roy, UT 84067 and is currently estimated at $342,157, approximately $299 per square foot. 4620 S 3900 W is a home located in Weber County with nearby schools including West Haven School, Sand Ridge Junior High School, and Roy High School.
Ownership History
Date
Name
Owned For
Owner Type
Purchase Details
Closed on
Mar 29, 2006
Sold by
Young Tyson
Bought by
Carter Karrie J
Current Estimated Value
Home Financials for this Owner
Home Financials are based on the most recent Mortgage that was taken out on this home.
Original Mortgage
$103,377
Outstanding Balance
$59,029
Interest Rate
6.25%
Mortgage Type
FHA
Estimated Equity
$283,128
Purchase Details
Closed on
Dec 26, 2001
Sold by
Young Tyson H and Young Tracy
Bought by
Young Tyson
Home Financials for this Owner
Home Financials are based on the most recent Mortgage that was taken out on this home.
Original Mortgage
$103,740
Interest Rate
6.51%
Mortgage Type
FHA
Purchase Details
Closed on
Aug 24, 1999
Sold by
Young Tyson H
Bought by
Young Tyson H
Purchase Details
Closed on
Feb 24, 1997
Sold by
Christensen Chris Ken and Christensen Jennifer Ann
Bought by
Young Tyson H
Home Financials for this Owner
Home Financials are based on the most recent Mortgage that was taken out on this home.
Original Mortgage
$83,742
Interest Rate
7.86%
Mortgage Type
FHA
Create a Home Valuation Report for This Property
The Home Valuation Report is an in-depth analysis detailing your home's value as well as a comparison with similar homes in the area
Home Values in the Area
Average Home Value in this Area
Purchase History
| Date | Buyer | Sale Price | Title Company |
|---|---|---|---|
| Carter Karrie J | -- | Utah Commercial Title | |
| Young Tyson | -- | Backman Stewart Title | |
| Young Tyson H | -- | First American Title | |
| Young Tyson H | -- | First American Title |
Source: Public Records
Mortgage History
| Date | Status | Borrower | Loan Amount |
|---|---|---|---|
| Open | Carter Karrie J | $103,377 | |
| Previous Owner | Young Tyson | $103,740 | |
| Previous Owner | Young Tyson H | $83,742 |
Source: Public Records
Tax History Compared to Growth
Tax History
| Year | Tax Paid | Tax Assessment Tax Assessment Total Assessment is a certain percentage of the fair market value that is determined by local assessors to be the total taxable value of land and additions on the property. | Land | Improvement |
|---|---|---|---|---|
| 2025 | $1,700 | $299,964 | $96,460 | $203,504 |
| 2024 | $1,660 | $162,250 | $53,053 | $109,197 |
| 2023 | $1,601 | $156,750 | $48,337 | $108,413 |
| 2022 | $1,677 | $167,200 | $45,542 | $121,658 |
| 2021 | $1,391 | $230,000 | $58,364 | $171,636 |
| 2020 | $1,202 | $182,000 | $58,364 | $123,636 |
| 2019 | $1,147 | $164,000 | $33,723 | $130,277 |
| 2018 | $1,124 | $152,000 | $29,820 | $122,180 |
| 2017 | $974 | $124,000 | $29,820 | $94,180 |
| 2016 | $918 | $63,029 | $16,480 | $46,549 |
| 2015 | $852 | $60,721 | $16,480 | $44,241 |
| 2014 | $747 | $52,646 | $16,480 | $36,166 |
Source: Public Records
Map
Nearby Homes
- 4024 W 4650 S
- 3692 W 4625 S
- 3669 W 4625 S
- 3671 W 4700 S
- 3652 W 4625 S
- 3632 W 4650 S
- 3627 W 4650 S
- 4094 W 4700 S
- Villages Townhome Plan at Green Farm - Villages
- 4097 W 4750 S
- 4106 W 4875 S
- Poplar Plan at Highgate Cove
- Pando Plan at Highgate Cove
- 4890 S 4075 W
- 3820 Foxglen Dr
- 4141 W 4875 S
- 4990 S 4075 W
- 4021 W 5000 S
- 3524 W 4835 S Unit 22
- 3523 W 4835 S Unit 28