Estimated Value: $407,000 - $450,000
3
Beds
1
Bath
1,964
Sq Ft
$216/Sq Ft
Est. Value
About This Home
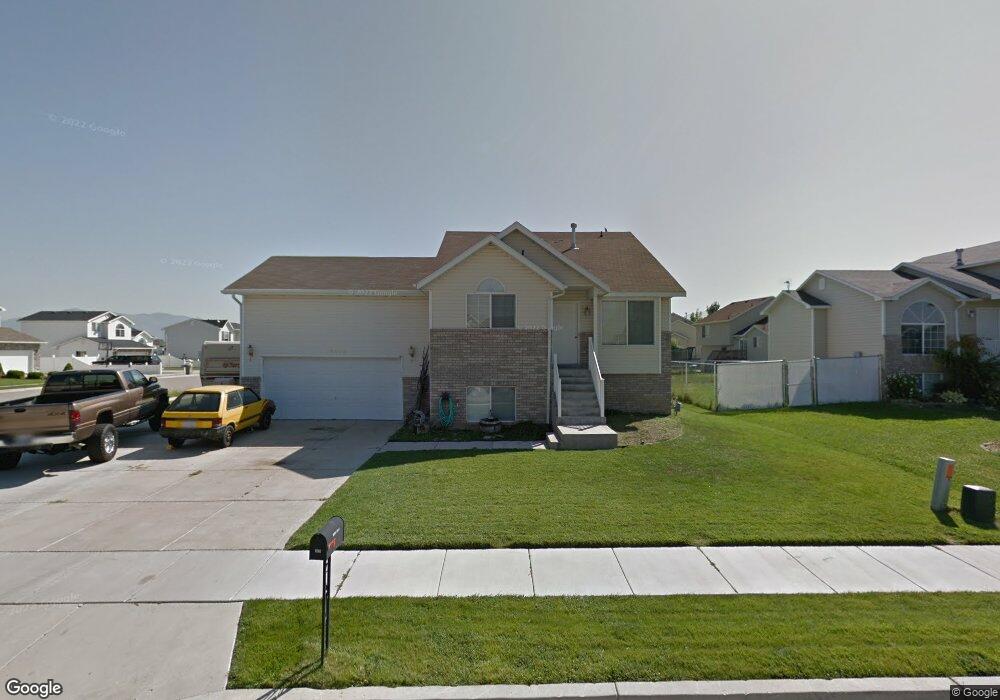
This home is located at 4620 S 4150 W, Roy, UT 84067 and is currently estimated at $423,974, approximately $215 per square foot. 4620 S 4150 W is a home located in Weber County with nearby schools including West Haven School, Sand Ridge Junior High School, and Roy High School.
Ownership History
Date
Name
Owned For
Owner Type
Purchase Details
Closed on
Feb 24, 2006
Sold by
Vandenberg Jeremy C
Bought by
Vandenberg Jeremy C
Current Estimated Value
Home Financials for this Owner
Home Financials are based on the most recent Mortgage that was taken out on this home.
Original Mortgage
$136,010
Outstanding Balance
$76,276
Interest Rate
6.04%
Mortgage Type
FHA
Estimated Equity
$347,698
Purchase Details
Closed on
Jun 28, 2002
Sold by
Northern Regal Homes Inc
Bought by
Vandenberg Jeremy C
Home Financials for this Owner
Home Financials are based on the most recent Mortgage that was taken out on this home.
Original Mortgage
$121,600
Interest Rate
6.86%
Purchase Details
Closed on
Jul 18, 2001
Sold by
Corporation Of The Presiding Bishop Of T
Bought by
Northern Regal Homes Inc
Purchase Details
Closed on
Feb 5, 2001
Sold by
Academy Mtg Midvale Lc
Bought by
Shaw John Duane and Shaw Marci
Create a Home Valuation Report for This Property
The Home Valuation Report is an in-depth analysis detailing your home's value as well as a comparison with similar homes in the area
Home Values in the Area
Average Home Value in this Area
Purchase History
| Date | Buyer | Sale Price | Title Company |
|---|---|---|---|
| Vandenberg Jeremy C | -- | Sutherland Title Company | |
| Vandenberg Jeremy C | -- | Mountain View Title | |
| Northern Regal Homes Inc | -- | Founders Title Co | |
| Shaw John Duane | -- | Founders Title Co |
Source: Public Records
Mortgage History
| Date | Status | Borrower | Loan Amount |
|---|---|---|---|
| Open | Vandenberg Jeremy C | $136,010 | |
| Closed | Vandenberg Jeremy C | $121,600 |
Source: Public Records
Tax History Compared to Growth
Tax History
| Year | Tax Paid | Tax Assessment Tax Assessment Total Assessment is a certain percentage of the fair market value that is determined by local assessors to be the total taxable value of land and additions on the property. | Land | Improvement |
|---|---|---|---|---|
| 2025 | $2,431 | $382,150 | $130,015 | $252,135 |
| 2024 | $2,375 | $206,799 | $71,508 | $135,291 |
| 2023 | $2,290 | $199,650 | $68,739 | $130,911 |
| 2022 | $2,346 | $211,200 | $60,501 | $150,699 |
| 2021 | $1,955 | $289,000 | $79,963 | $209,037 |
| 2020 | $1,921 | $262,000 | $79,963 | $182,037 |
| 2019 | $1,813 | $232,000 | $49,906 | $182,094 |
| 2018 | $1,722 | $207,000 | $42,041 | $164,959 |
| 2017 | $1,580 | $177,000 | $42,041 | $134,959 |
| 2016 | $1,583 | $95,796 | $21,944 | $73,852 |
| 2015 | $1,401 | $86,017 | $21,944 | $64,073 |
| 2014 | $1,294 | $77,720 | $19,237 | $58,483 |
Source: Public Records
Map
Nearby Homes
- 4094 W 4700 S
- 4097 W 4750 S
- 4024 W 4650 S
- 4756 S 4300 W
- 4106 W 4875 S
- 4141 W 4875 S
- 4890 S 4075 W
- 4990 S 4075 W
- 5013 S 4150 W
- 4021 W 5000 S
- 4218 W 5050 S
- 3692 W 4625 S
- 3669 W 4625 S
- 3671 W 4700 S
- 5116 S 4300 W
- 4556 W 4950 S
- 3820 Foxglen Dr
- 3652 W 4625 S
- 3632 W 4650 S
- Villages Townhome Plan at Green Farm - Villages