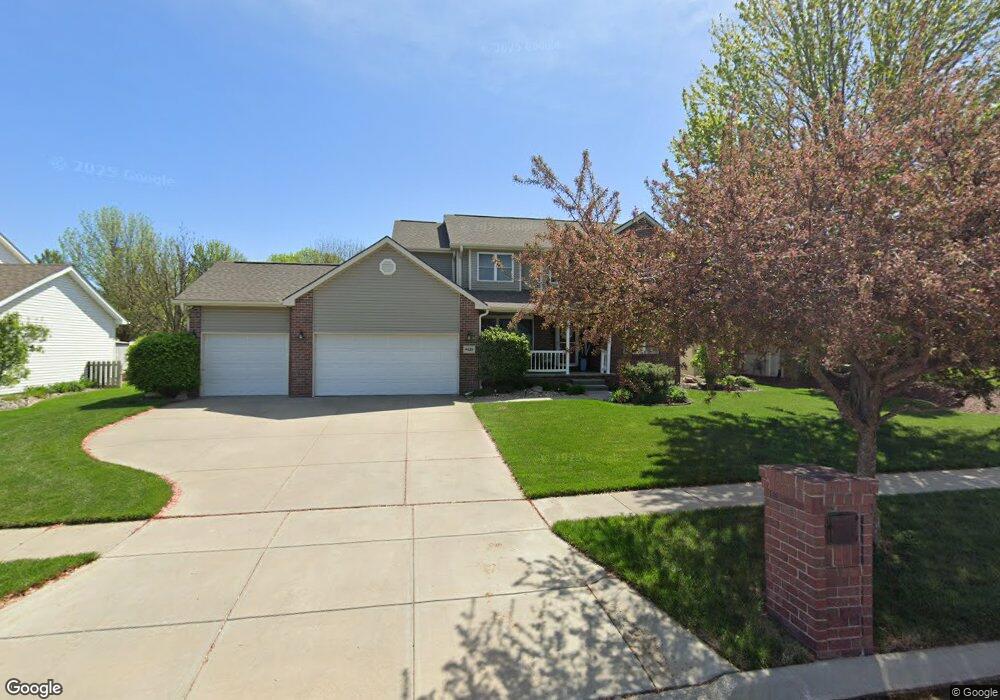
4620 S 86th Ct Lincoln, NE 68526
Firethorn NeighborhoodEstimated Value: $486,068 - $704,000
5
Beds
4
Baths
3,191
Sq Ft
$178/Sq Ft
Est. Value
About This Home
This home is located at 4620 S 86th Ct, Lincoln, NE 68526 and is currently estimated at $569,267, approximately $178 per square foot. 4620 S 86th Ct is a home located in Lancaster County with nearby schools including Maxey Elementary School, Lux Middle School, and Lincoln East High School.
Ownership History
Date
Name
Owned For
Owner Type
Purchase Details
Closed on
Jun 5, 2011
Sold by
Unger Greg A and Unger Deana M
Bought by
Baehr Zachary J and Baehr Kara M Meinke
Current Estimated Value
Home Financials for this Owner
Home Financials are based on the most recent Mortgage that was taken out on this home.
Original Mortgage
$247,410
Outstanding Balance
$170,105
Interest Rate
4.65%
Mortgage Type
Future Advance Clause Open End Mortgage
Estimated Equity
$399,162
Purchase Details
Closed on
Aug 16, 2001
Sold by
Meyer Homes Inc
Bought by
Unger Greg A and Unger Deana M
Home Financials for this Owner
Home Financials are based on the most recent Mortgage that was taken out on this home.
Original Mortgage
$170,400
Interest Rate
7.14%
Purchase Details
Closed on
Mar 22, 2001
Sold by
Pioneer Greens Llc
Bought by
Meyer Homes Inc
Home Financials for this Owner
Home Financials are based on the most recent Mortgage that was taken out on this home.
Original Mortgage
$140,400
Interest Rate
6.95%
Mortgage Type
Construction
Create a Home Valuation Report for This Property
The Home Valuation Report is an in-depth analysis detailing your home's value as well as a comparison with similar homes in the area
Home Values in the Area
Average Home Value in this Area
Purchase History
| Date | Buyer | Sale Price | Title Company |
|---|---|---|---|
| Baehr Zachary J | $275,000 | Nltal | |
| Unger Greg A | $213,000 | -- | |
| Meyer Homes Inc | $37,000 | -- |
Source: Public Records
Mortgage History
| Date | Status | Borrower | Loan Amount |
|---|---|---|---|
| Open | Baehr Zachary J | $247,410 | |
| Previous Owner | Unger Greg A | $170,400 | |
| Previous Owner | Meyer Homes Inc | $140,400 |
Source: Public Records
Tax History Compared to Growth
Tax History
| Year | Tax Paid | Tax Assessment Tax Assessment Total Assessment is a certain percentage of the fair market value that is determined by local assessors to be the total taxable value of land and additions on the property. | Land | Improvement |
|---|---|---|---|---|
| 2025 | $5,967 | $414,000 | $75,000 | $339,000 |
| 2024 | $5,967 | $425,400 | $75,000 | $350,400 |
| 2023 | $6,575 | $392,300 | $75,000 | $317,300 |
| 2022 | $7,127 | $357,600 | $70,000 | $287,600 |
| 2021 | $6,742 | $357,600 | $70,000 | $287,600 |
| 2020 | $6,122 | $320,400 | $70,000 | $250,400 |
| 2019 | $6,123 | $320,400 | $70,000 | $250,400 |
| 2018 | $5,632 | $293,400 | $70,000 | $223,400 |
| 2017 | $5,684 | $293,400 | $70,000 | $223,400 |
| 2016 | $5,041 | $258,900 | $60,000 | $198,900 |
| 2015 | $5,078 | $258,900 | $60,000 | $198,900 |
| 2014 | $5,452 | $276,000 | $60,000 | $216,000 |
| 2013 | -- | $276,000 | $60,000 | $216,000 |
Source: Public Records
Map
Nearby Homes
- 8711 Labrador Ct
- 8701 Labrador Ct
- 4440 Pagoda Ln
- 820 S 88th St
- 436 S 88th St
- 8440 Birkett Dr
- 8439 Birkett Dr
- 4919 S 89th St
- 4121 Taliesin Dr
- 4940 S 89th St
- 8017 Meredeth St
- 8610 Oakmont Dr
- 4701 Hawthorne Dr
- 7814 Phares Dr
- 5241 Troon Dr
- 7841 Preserve Ln
- 7739 Phares Dr
- 5335 Troon Dr
- 8110 Cooper Ct
- 4840 S 77th St
- 4630 S 86th Ct
- 4610 S 86th Ct
- 4621 Pioneer Greens Ct
- 4640 S 86th Ct
- 4611 Pioneer Greens Ct
- 4631 Pioneer Greens Ct
- 4600 S 86th Ct
- 4621 S 86th Ct
- 4631 S 86th Ct
- 4641 Pioneer Greens Ct
- 4601 Pioneer Greens Ct
- 0 S 86th Ct
- 4601 S 86th Ct
- 4641 S 86th Ct
- 4650 S 86th Ct
- 4651 Pioneer Greens Ct
- 4614 S 85th Cir
- 4620 Pioneer Greens Ct
- 8611 Pioneer Greens Ct
- 4620 S 85th Cir