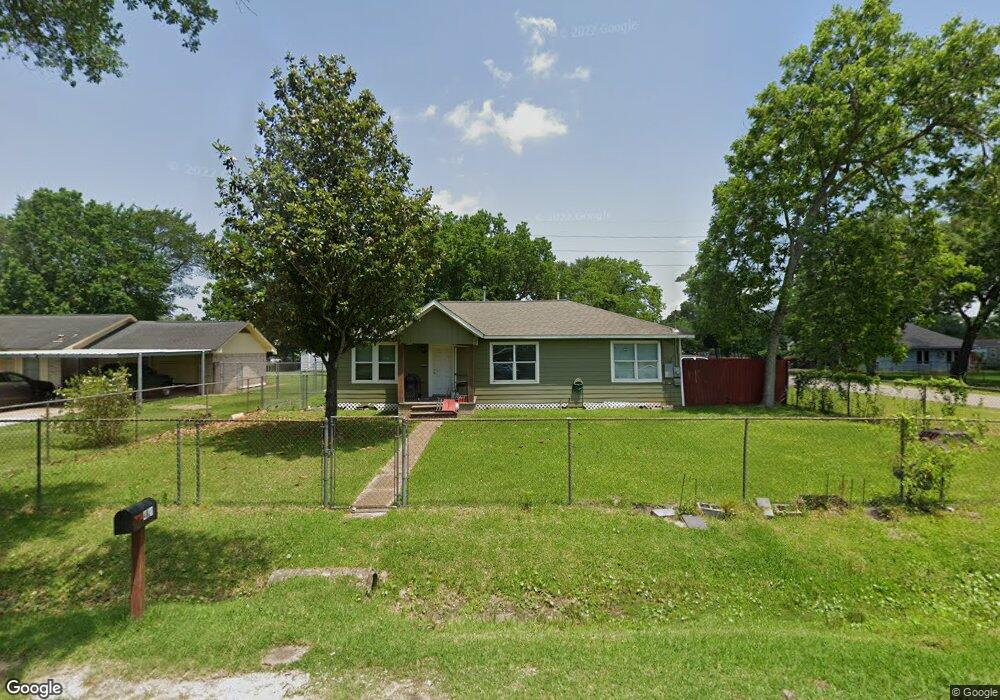
4621 Fitch St Houston, TX 77016
Trinity-Houston Gardens NeighborhoodEstimated Value: $178,078 - $208,000
3
Beds
1
Bath
1,196
Sq Ft
$161/Sq Ft
Est. Value
About This Home
This home is located at 4621 Fitch St, Houston, TX 77016 and is currently estimated at $192,270, approximately $160 per square foot. 4621 Fitch St is a home located in Harris County with nearby schools including Felix Cook Jr. Elementary School, Key Middle, and Kashmere High School.
Ownership History
Date
Name
Owned For
Owner Type
Purchase Details
Closed on
Jul 15, 2008
Sold by
Julian Preston
Bought by
Suarez Miguel Angel and Suarez Paulina L
Current Estimated Value
Home Financials for this Owner
Home Financials are based on the most recent Mortgage that was taken out on this home.
Original Mortgage
$40,500
Interest Rate
6.09%
Mortgage Type
Seller Take Back
Purchase Details
Closed on
May 1, 2008
Sold by
Newman Bert
Bought by
Julian Preston
Purchase Details
Closed on
Nov 17, 2007
Sold by
Julian Preston
Bought by
Newman Bert
Purchase Details
Closed on
Sep 4, 2007
Sold by
Bradley Anthony R
Bought by
Julian Preston J
Purchase Details
Closed on
Apr 30, 1997
Sold by
Smith Tommie Sue Burlin and Black Cheryl Ann Burlin
Bought by
Bradley Anthony R
Home Financials for this Owner
Home Financials are based on the most recent Mortgage that was taken out on this home.
Original Mortgage
$17,000
Interest Rate
9.25%
Create a Home Valuation Report for This Property
The Home Valuation Report is an in-depth analysis detailing your home's value as well as a comparison with similar homes in the area
Home Values in the Area
Average Home Value in this Area
Purchase History
| Date | Buyer | Sale Price | Title Company |
|---|---|---|---|
| Suarez Miguel Angel | -- | None Available | |
| Julian Preston | -- | None Available | |
| Newman Bert | -- | None Available | |
| Julian Preston J | $15,100 | None Available | |
| Bradley Anthony R | -- | Texas American Title Company |
Source: Public Records
Mortgage History
| Date | Status | Borrower | Loan Amount |
|---|---|---|---|
| Closed | Suarez Miguel Angel | $40,500 | |
| Previous Owner | Bradley Anthony R | $17,000 |
Source: Public Records
Tax History Compared to Growth
Tax History
| Year | Tax Paid | Tax Assessment Tax Assessment Total Assessment is a certain percentage of the fair market value that is determined by local assessors to be the total taxable value of land and additions on the property. | Land | Improvement |
|---|---|---|---|---|
| 2025 | $452 | $177,241 | $66,188 | $111,053 |
| 2024 | $452 | $177,241 | $66,188 | $111,053 |
| 2023 | $452 | $169,023 | $66,188 | $102,835 |
| 2022 | $837 | $131,504 | $44,125 | $87,379 |
| 2021 | $805 | $103,224 | $28,681 | $74,543 |
| 2020 | $760 | $44,086 | $19,856 | $24,230 |
| 2019 | $722 | $34,496 | $14,120 | $20,376 |
| 2018 | $275 | $30,861 | $14,120 | $16,741 |
| 2017 | $597 | $30,861 | $14,120 | $16,741 |
| 2016 | $542 | $27,600 | $11,031 | $16,569 |
| 2015 | $199 | $19,500 | $8,825 | $10,675 |
| 2014 | $199 | $19,500 | $8,825 | $10,675 |
Source: Public Records
Map
Nearby Homes
- 4622 Firnat St
- 4814 Firnat St
- 4506 Boicewood St
- 4600 Ireland St
- 4613 Ireland St Unit B
- 4527 Ireland St
- 4625 Laura Koppe Rd
- 4525 Ireland St
- 4622 Tidwell Rd
- 4915 Fitch St
- 4924 Tronewood St
- 4917 Tronewood St
- 5017 Boicewood St
- 4606 Tidwell Rd
- 5105 Earline St
- 5109 Earline St
- 8613 Lavender St
- 9217 Friendly Rd
- 5022 Laura Koppe Rd
- 7212 Lockwood Dr