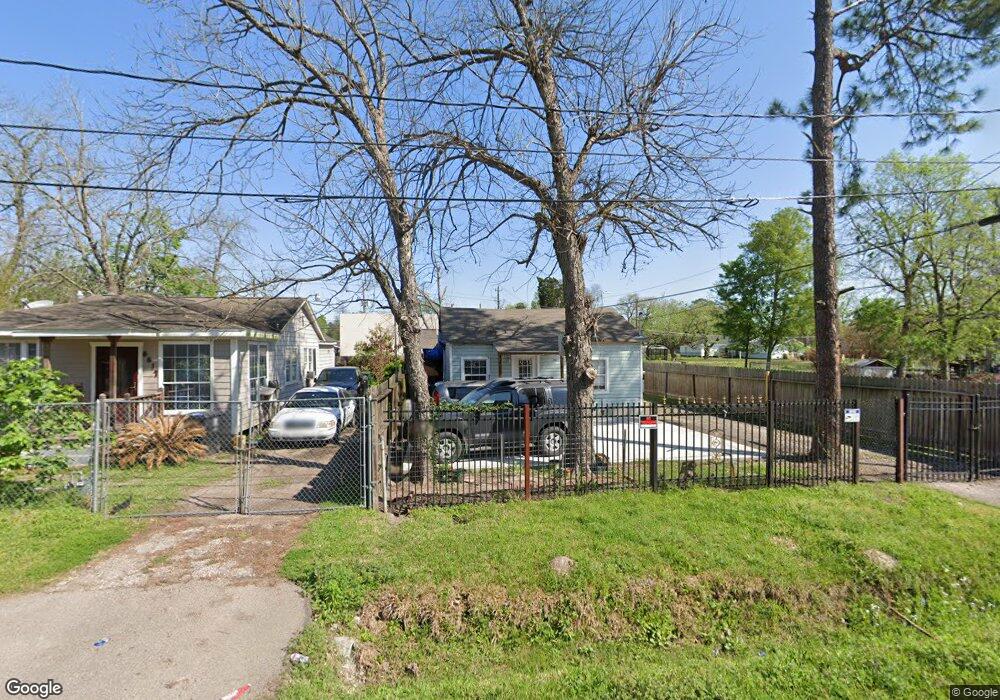
4621 Plaag St Houston, TX 77016
Trinity-Houston Gardens NeighborhoodEstimated Value: $112,000 - $166,000
2
Beds
1
Bath
864
Sq Ft
$169/Sq Ft
Est. Value
About This Home
This home is located at 4621 Plaag St, Houston, TX 77016 and is currently estimated at $146,198, approximately $169 per square foot. 4621 Plaag St is a home located in Harris County with nearby schools including Felix Cook Jr. Elementary School, Key Middle, and Kashmere High School.
Ownership History
Date
Name
Owned For
Owner Type
Purchase Details
Closed on
Jan 13, 2023
Sold by
Cenborain Alejandra
Bought by
Hockenberry Aleida S
Current Estimated Value
Purchase Details
Closed on
Mar 29, 2017
Sold by
Martinez Susan Michelle and Martinez Charlie
Bought by
Rivas Jose O and Rivas Marco T
Home Financials for this Owner
Home Financials are based on the most recent Mortgage that was taken out on this home.
Original Mortgage
$45,000
Interest Rate
4.15%
Mortgage Type
Purchase Money Mortgage
Purchase Details
Closed on
Aug 11, 2016
Sold by
Tippys Soul Food Llc
Bought by
Martineez Susan Michelle
Purchase Details
Closed on
Nov 10, 2014
Sold by
Parker Tiffany T Thompson
Bought by
Tippys Soul Food Llc and Parker Tiffany T Thompson
Purchase Details
Closed on
Aug 5, 2008
Sold by
Sanchez Jesus and Sanchez Jessie
Bought by
Thompson Tiffany Tia
Purchase Details
Closed on
Apr 11, 2008
Sold by
Sanchez Jesus and Sanchez Jessie
Bought by
County Of Harris
Create a Home Valuation Report for This Property
The Home Valuation Report is an in-depth analysis detailing your home's value as well as a comparison with similar homes in the area
Home Values in the Area
Average Home Value in this Area
Purchase History
| Date | Buyer | Sale Price | Title Company |
|---|---|---|---|
| Hockenberry Aleida S | -- | -- | |
| Rivas Jose O | -- | None Available | |
| Martineez Susan Michelle | -- | None Available | |
| Tippys Soul Food Llc | -- | None Available | |
| Thompson Tiffany Tia | $4,500 | None Available | |
| County Of Harris | -- | None Available |
Source: Public Records
Mortgage History
| Date | Status | Borrower | Loan Amount |
|---|---|---|---|
| Previous Owner | Rivas Jose O | $45,000 |
Source: Public Records
Tax History Compared to Growth
Tax History
| Year | Tax Paid | Tax Assessment Tax Assessment Total Assessment is a certain percentage of the fair market value that is determined by local assessors to be the total taxable value of land and additions on the property. | Land | Improvement |
|---|---|---|---|---|
| 2025 | $2,883 | $127,444 | $52,044 | $75,400 |
| 2024 | $2,883 | $141,883 | $52,044 | $89,839 |
| 2023 | $2,883 | $114,840 | $38,009 | $76,831 |
| 2022 | $1,800 | $81,729 | $24,852 | $56,877 |
| 2021 | $1,587 | $68,073 | $14,619 | $53,454 |
| 2020 | $1,417 | $58,512 | $14,619 | $43,893 |
| 2019 | $1,481 | $58,512 | $14,619 | $43,893 |
| 2018 | $1,162 | $45,938 | $12,572 | $33,366 |
| 2017 | $563 | $22,262 | $12,572 | $9,690 |
| 2016 | $320 | $12,672 | $12,572 | $100 |
| 2015 | -- | $22,000 | $16,446 | $5,554 |
| 2014 | -- | $22,000 | $16,446 | $5,554 |
Source: Public Records
Map
Nearby Homes
- 4825 Weaver Rd
- 7938 Pointer St
- 7902 Pointer St
- 0 Keeland St Unit 64861336
- 8033 Lockwood Dr
- 7911 Wileyvale Rd
- 4323 Weaver Rd
- 4317 Plaag St
- 4315 Plaag St
- 7310 Lockwood Dr
- 8613 Lavender St
- 4327 June St
- 5123 E Crosstimbers St
- 7711 Wileyvale Rd
- 7212 Lockwood Dr
- 8617 Clarington St
- 4209 Tampico St
- 4221 E Toliver St
- 7508 Glass St
- 4419 Denmark St