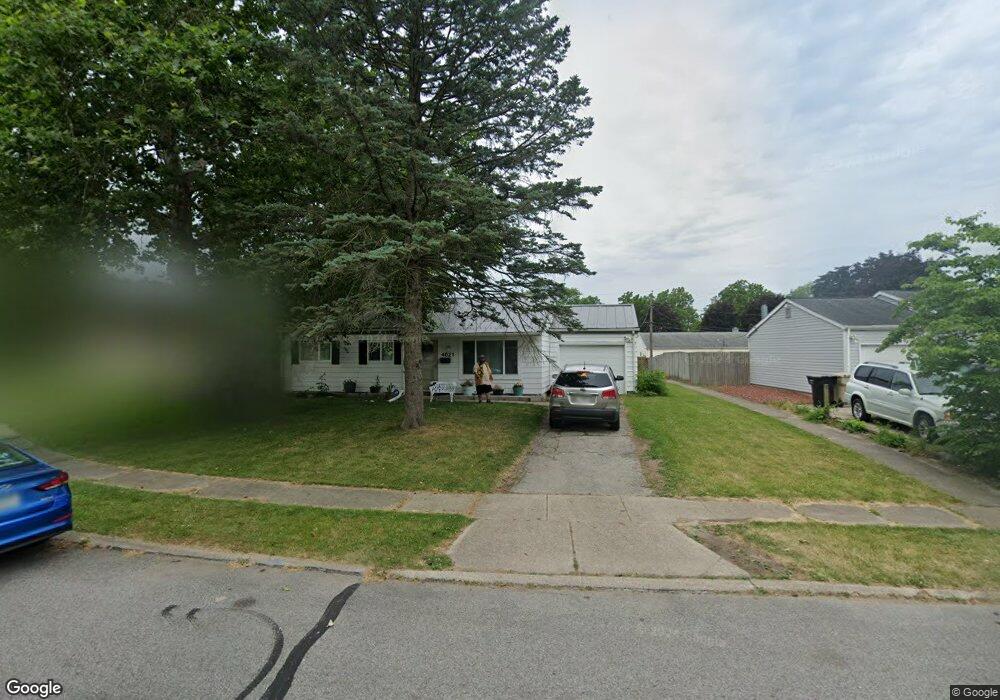
4621 SW Macgregor Rd South Bend, IN 46614
Scottsdale NeighborhoodEstimated Value: $176,000 - $218,000
3
Beds
2
Baths
1,152
Sq Ft
$166/Sq Ft
Est. Value
About This Home
This home is located at 4621 SW Macgregor Rd, South Bend, IN 46614 and is currently estimated at $190,838, approximately $165 per square foot. 4621 SW Macgregor Rd is a home located in St. Joseph County with nearby schools including Marshall Traditional School, Hay Elementary School, and Clay Intermediate Center.
Ownership History
Date
Name
Owned For
Owner Type
Purchase Details
Closed on
Sep 8, 2017
Sold by
Peterson Gary C
Bought by
Peterson Trust
Current Estimated Value
Purchase Details
Closed on
Sep 26, 2015
Sold by
Peterson Gary C and Peterson Gina A
Bought by
Peterson Gary C
Create a Home Valuation Report for This Property
The Home Valuation Report is an in-depth analysis detailing your home's value as well as a comparison with similar homes in the area
Home Values in the Area
Average Home Value in this Area
Purchase History
| Date | Buyer | Sale Price | Title Company |
|---|---|---|---|
| Peterson Trust | -- | -- | |
| Peterson Gary C | -- | -- |
Source: Public Records
Tax History Compared to Growth
Tax History
| Year | Tax Paid | Tax Assessment Tax Assessment Total Assessment is a certain percentage of the fair market value that is determined by local assessors to be the total taxable value of land and additions on the property. | Land | Improvement |
|---|---|---|---|---|
| 2024 | $1,664 | $99,900 | $38,900 | $61,000 |
| 2023 | $1,632 | $68,000 | $38,900 | $29,100 |
| 2022 | $1,632 | $68,000 | $38,900 | $29,100 |
| 2021 | $1,692 | $68,700 | $24,000 | $44,700 |
| 2020 | $1,504 | $60,900 | $21,300 | $39,600 |
| 2019 | $1,219 | $91,700 | $20,700 | $71,000 |
| 2018 | $1,858 | $76,000 | $17,200 | $58,800 |
| 2017 | $1,924 | $75,400 | $17,200 | $58,200 |
| 2016 | $2,600 | $100,300 | $17,200 | $83,100 |
| 2014 | $1,346 | $51,500 | $14,300 | $37,200 |
Source: Public Records
Map
Nearby Homes
- 4555 Macdougall Ct
- 1713 Thornhill Dr
- 1719 Thornhill Dr
- 1725 Thornhill Dr
- 1426 Oakdale Dr
- 1515 Strathmore Ct
- 1839 Renfrew Dr
- 5015 Kirkshire Dr
- 5002 Heather Ln
- 4108 Woodvale Dr
- 4020 Brookton Dr
- 1132 Byron Dr
- 2032 Southern View
- 5305 Monticello Ct
- 1411 Cambridge Dr
- 1617 Inwood Rd
- 17746 Hartman St
- 1303 E Erskine Manor Hill
- 5428 Raleigh Dr
- 821 Eagle Cove Dr
- 4615 SW Macgregor Rd
- 4629 SW Macgregor Rd
- 4626 Crawford Ct
- 4609 SW Macgregor Rd
- 4618 SW Macgregor Rd
- 4610 SW Macgregor Rd
- 4633 SW Macgregor Rd
- 4634 Crawford Ct
- 4620 Crawford Ct
- 1702 SE Macgregor Rd
- 1707 SE Macgregor Rd
- 4601 SW Macgregor Rd
- 4614 Crawford Ct
- 4635 Crawford Ct
- 1710 SE Macgregor Rd
- 4602 SW Macgregor Rd
- 4546 SW Macgregor Rd
- 4545 SW Macgregor Rd
- 4547 Macdougall Ct
- 4602 Crawford Ct