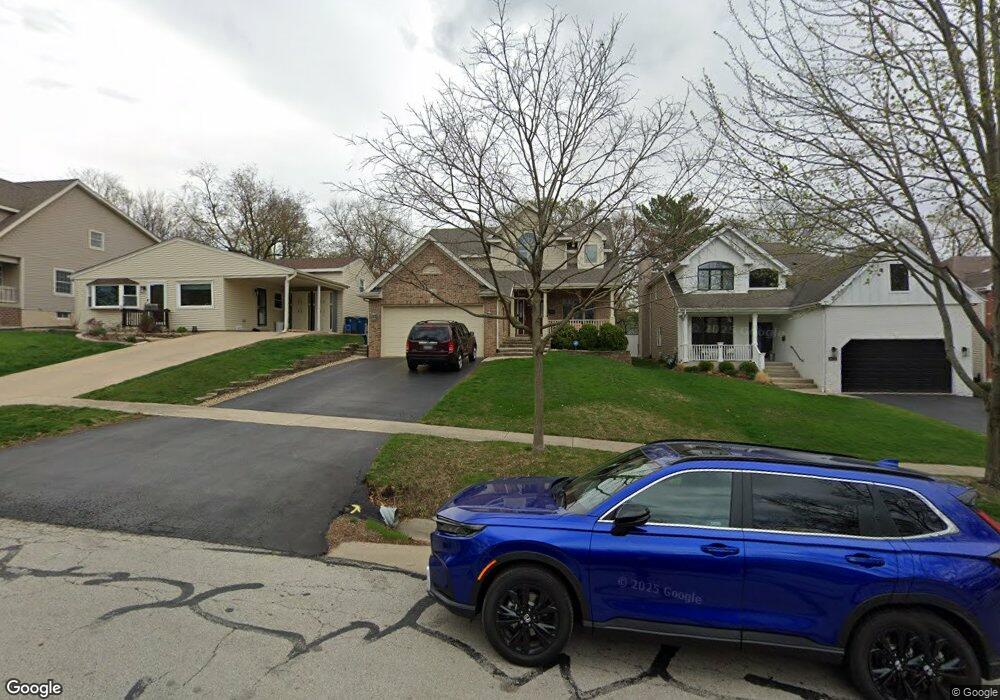
4621 Wilson Ave Downers Grove, IL 60515
Estimated Value: $781,000 - $925,000
4
Beds
3
Baths
2,481
Sq Ft
$338/Sq Ft
Est. Value
About This Home
This home is located at 4621 Wilson Ave, Downers Grove, IL 60515 and is currently estimated at $839,326, approximately $338 per square foot. 4621 Wilson Ave is a home located in DuPage County with nearby schools including Henry Puffer School, Herrick Middle School, and Downer Grove North High School.
Ownership History
Date
Name
Owned For
Owner Type
Purchase Details
Closed on
Apr 12, 2004
Sold by
J W D Enterprises Inc
Bought by
Knezevich Michael P and Friedel Barbara E
Current Estimated Value
Home Financials for this Owner
Home Financials are based on the most recent Mortgage that was taken out on this home.
Original Mortgage
$235,550
Outstanding Balance
$109,608
Interest Rate
5.5%
Mortgage Type
Purchase Money Mortgage
Estimated Equity
$729,718
Purchase Details
Closed on
Jan 31, 2003
Sold by
West Gary T
Bought by
J W D Enterprises Inc
Home Financials for this Owner
Home Financials are based on the most recent Mortgage that was taken out on this home.
Original Mortgage
$388,500
Interest Rate
4.75%
Mortgage Type
Construction
Purchase Details
Closed on
Jul 17, 1996
Sold by
West Dorothy A
Bought by
West Gary T
Purchase Details
Closed on
Aug 12, 1994
Sold by
West Sharon A and West Gary T
Bought by
West Dorothy A
Create a Home Valuation Report for This Property
The Home Valuation Report is an in-depth analysis detailing your home's value as well as a comparison with similar homes in the area
Home Values in the Area
Average Home Value in this Area
Purchase History
| Date | Buyer | Sale Price | Title Company |
|---|---|---|---|
| Knezevich Michael P | $560,000 | Chicago Title Insurance Comp | |
| J W D Enterprises Inc | $165,000 | Attorneys Title Guaranty Fun | |
| West Gary T | -- | -- | |
| West Dorothy A | -- | -- |
Source: Public Records
Mortgage History
| Date | Status | Borrower | Loan Amount |
|---|---|---|---|
| Open | Knezevich Michael P | $235,550 | |
| Previous Owner | J W D Enterprises Inc | $388,500 | |
| Closed | Knezevich Michael P | $100,000 |
Source: Public Records
Tax History Compared to Growth
Tax History
| Year | Tax Paid | Tax Assessment Tax Assessment Total Assessment is a certain percentage of the fair market value that is determined by local assessors to be the total taxable value of land and additions on the property. | Land | Improvement |
|---|---|---|---|---|
| 2024 | $12,833 | $240,386 | $55,136 | $185,250 |
| 2023 | $12,114 | $219,390 | $50,320 | $169,070 |
| 2022 | $12,559 | $219,390 | $50,320 | $169,070 |
| 2021 | $11,454 | $211,100 | $48,420 | $162,680 |
| 2020 | $11,272 | $207,310 | $47,550 | $159,760 |
| 2019 | $10,897 | $198,340 | $45,490 | $152,850 |
| 2018 | $10,481 | $188,360 | $43,200 | $145,160 |
| 2017 | $10,199 | $182,000 | $41,740 | $140,260 |
| 2016 | $10,103 | $175,420 | $40,230 | $135,190 |
| 2015 | $10,011 | $165,190 | $37,880 | $127,310 |
| 2014 | $9,930 | $159,250 | $36,520 | $122,730 |
| 2013 | $9,801 | $159,630 | $36,610 | $123,020 |
Source: Public Records
Map
Nearby Homes
- 4601 Wilson Ave
- 4512 Wilson Ave
- 4508 Stonewall Ave
- 4408 Stonewall Ave
- 4424 Arbor Cir Unit 3
- 4522 Lee Ave
- 2209 Arbor Cir Unit 5
- 4940 Cornell Ave
- 4947 Stonewall Ave
- 4436 Lee Ave
- 4939 Lee Ave
- 1805 Gilbert Ave
- 4848 Francisco Ave
- 1436 Gilbert Lot 1 Ave
- 4022 Earlston Rd
- 4832 Seeley Ave
- 4416 Seeley Ave
- 4741 Montgomery Ave
- 4812 Oakwood Ave
- 4941 Montgomery Ave
- 4623 Wilson Ave
- 4617 Wilson Ave
- 4627 Wilson Ave
- 4613 Wilson Ave
- 4633 Wilson Ave
- 4626 Woodward Ave
- 4620 Woodward Ave
- 4612 Woodward Ave
- 4637 Wilson Ave
- 4624 Wilson Ave
- 4632 Woodward Ave
- 4605 Wilson Ave
- 4608 Woodward Ave
- 4620 Wilson Ave
- 4616 Wilson Ave
- 4628 Wilson Ave
- 4632 Wilson Ave
- 4612 Wilson Ave
- 4604 Woodward Ave
- 4604 Wilson Ave