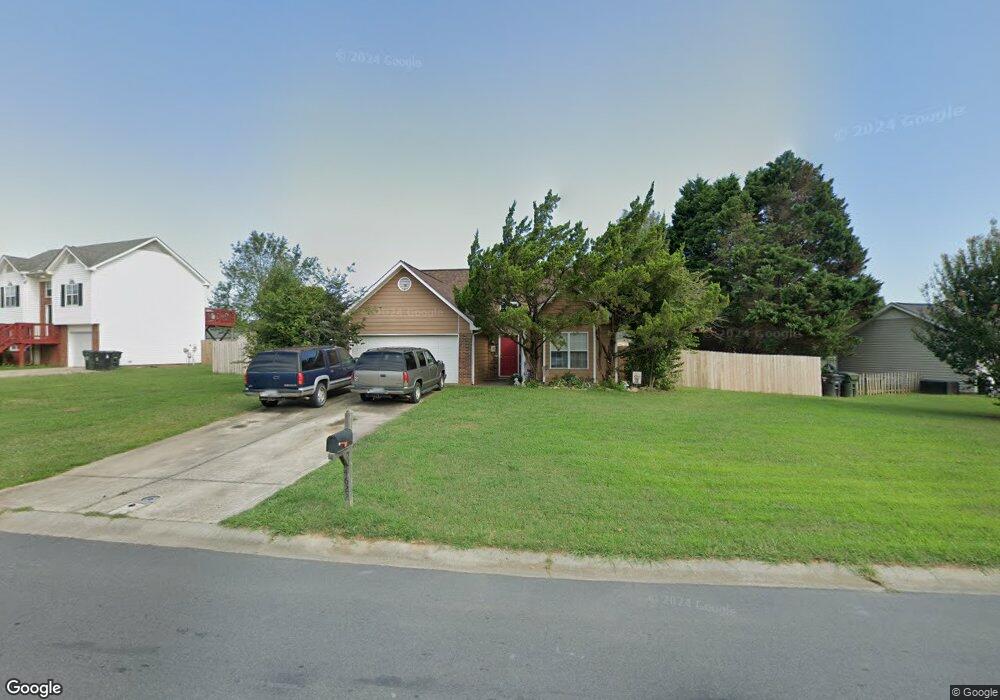
4622 Falcon Chase Dr SW Concord, NC 28027
Estimated Value: $328,000 - $345,692
3
Beds
3
Baths
1,650
Sq Ft
$204/Sq Ft
Est. Value
About This Home
This home is located at 4622 Falcon Chase Dr SW, Concord, NC 28027 and is currently estimated at $336,673, approximately $204 per square foot. 4622 Falcon Chase Dr SW is a home located in Cabarrus County with nearby schools including Pitts School Road Elementary School, Roberta Road Middle School, and Jay M. Robinson High School.
Ownership History
Date
Name
Owned For
Owner Type
Purchase Details
Closed on
Nov 21, 2014
Sold by
Grice James J and Grice Christina L
Bought by
Grice James J
Current Estimated Value
Home Financials for this Owner
Home Financials are based on the most recent Mortgage that was taken out on this home.
Original Mortgage
$90,000
Outstanding Balance
$30,613
Interest Rate
4%
Mortgage Type
New Conventional
Estimated Equity
$306,060
Purchase Details
Closed on
Nov 21, 2003
Sold by
Grice James J and Small Christina L
Bought by
Grice James J and Grice Christina L
Home Financials for this Owner
Home Financials are based on the most recent Mortgage that was taken out on this home.
Original Mortgage
$110,400
Interest Rate
6.04%
Mortgage Type
Purchase Money Mortgage
Purchase Details
Closed on
Mar 1, 1996
Sold by
Grice James J
Bought by
Grice James J
Create a Home Valuation Report for This Property
The Home Valuation Report is an in-depth analysis detailing your home's value as well as a comparison with similar homes in the area
Home Values in the Area
Average Home Value in this Area
Purchase History
| Date | Buyer | Sale Price | Title Company |
|---|---|---|---|
| Grice James J | -- | Boston National Title Agency | |
| Grice James J | -- | -- | |
| Grice James J | $121,500 | -- |
Source: Public Records
Mortgage History
| Date | Status | Borrower | Loan Amount |
|---|---|---|---|
| Open | Grice James J | $90,000 | |
| Closed | Grice James J | $110,400 |
Source: Public Records
Tax History Compared to Growth
Tax History
| Year | Tax Paid | Tax Assessment Tax Assessment Total Assessment is a certain percentage of the fair market value that is determined by local assessors to be the total taxable value of land and additions on the property. | Land | Improvement |
|---|---|---|---|---|
| 2025 | $3,071 | $308,320 | $60,000 | $248,320 |
| 2024 | $3,071 | $308,320 | $60,000 | $248,320 |
| 2023 | $2,057 | $168,620 | $40,000 | $128,620 |
| 2022 | $2,057 | $168,620 | $40,000 | $128,620 |
| 2021 | $2,057 | $168,620 | $40,000 | $128,620 |
| 2020 | $2,057 | $168,620 | $40,000 | $128,620 |
| 2019 | $1,584 | $129,810 | $19,000 | $110,810 |
| 2018 | $1,558 | $129,810 | $19,000 | $110,810 |
| 2017 | $1,532 | $129,810 | $19,000 | $110,810 |
| 2016 | $909 | $124,870 | $18,000 | $106,870 |
| 2015 | $1,473 | $124,870 | $18,000 | $106,870 |
| 2014 | $1,473 | $124,870 | $18,000 | $106,870 |
Source: Public Records
Map
Nearby Homes
- 4112 Alexis Ct SW
- 4333 Glen Eagles Ln SW
- 4114 Carolina Pointe Ct SW
- 706 King Fredrick Ln SW
- 4271 Millet St SW Unit 198
- 4266 Barley St SW
- 3878 Longwood Dr SW
- 5366 Hardister Place
- 4370 Coddle Creek Dr
- 287 Halton Crossing Dr SW
- 193 Halton Crossing Dr SW
- 842 Treva Anne Dr SW
- 849 Treva Anne Dr SW
- 4349 Roberta Rd
- 3811 Bent Creek Dr SW
- 3807 Bent Creek Dr SW
- 5361 Brickyard Terrace Ct
- 3709 Bentley Place SW
- 4901 Riverview Dr
- 3907 Melissa Dr
- 4622 Falcon Chase Dr SW
- 4618 Falcon Chase Dr SW
- 4626 Falcon Chase Dr SW
- 4621 Falcon Chase Dr SW
- 4572 Sunchase Ct NW
- 4616 Falcon Chase Dr SW
- 4628 Falcon Chase Dr SW
- 4576 Sunchase Ct NW
- 4619 Falcon Chase Dr SW
- 4568 Sunchase Ct NW
- 4625 Falcon Chase Dr SW
- 4627 Falcon Chase Dr SW
- 4617 Falcon Chase Dr SW
- 4617 Falcon Chase Dr SW Unit 91
- 4629 Falcon Chase Dr SW
- 4578 Sunchase Ct SW
- 4564 Sunchase Ct NW
- 4578 Sunchase Ct NW
- 4633 Falcon Chase Dr SW
- 4613 Falcon Chase Dr SW