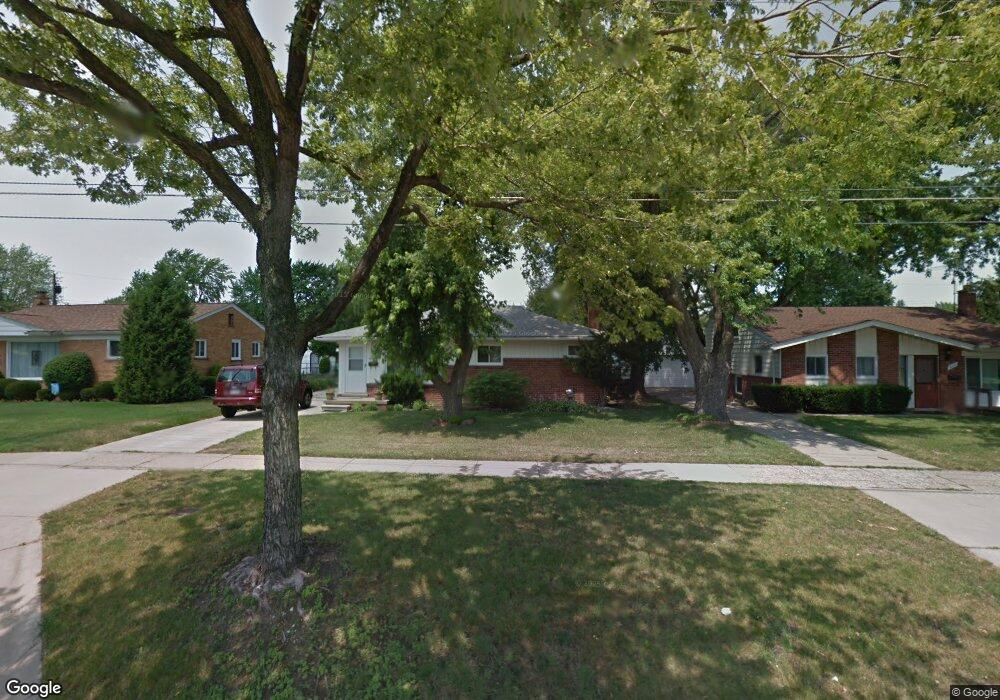
4623 E 13 Mile Rd Warren, MI 48092
Northwest Warren NeighborhoodEstimated Value: $222,289 - $251,000
3
Beds
2
Baths
1,195
Sq Ft
$198/Sq Ft
Est. Value
About This Home
This home is located at 4623 E 13 Mile Rd, Warren, MI 48092 and is currently estimated at $236,822, approximately $198 per square foot. 4623 E 13 Mile Rd is a home located in Macomb County with nearby schools including Green Acres Elementary School, Beer Middle School, and Warren Mott High School.
Ownership History
Date
Name
Owned For
Owner Type
Purchase Details
Closed on
Aug 24, 2023
Sold by
Safaa M Pauls And Eleni A Pauls Joint Tr
Bought by
Pauls Safaa M
Current Estimated Value
Home Financials for this Owner
Home Financials are based on the most recent Mortgage that was taken out on this home.
Original Mortgage
$118,000
Outstanding Balance
$115,296
Interest Rate
6.78%
Mortgage Type
New Conventional
Estimated Equity
$121,526
Purchase Details
Closed on
Feb 22, 2023
Sold by
Pauls Safaa and Pauls Eleni
Bought by
Safaa M And Eleni A Pauls Joint Trust
Purchase Details
Closed on
Sep 25, 2008
Sold by
Bery Leslie and Bery Phyllis
Bought by
Rinos Pauls Eleni and Rinos Eleftherior
Purchase Details
Closed on
Sep 30, 1999
Sold by
Al Maleh Walid N
Bought by
Pauls Safaa
Purchase Details
Closed on
Nov 7, 1994
Sold by
Claire M Yeske Est
Bought by
Al-Maleh Walid N and Al-Maleh Mary
Create a Home Valuation Report for This Property
The Home Valuation Report is an in-depth analysis detailing your home's value as well as a comparison with similar homes in the area
Home Values in the Area
Average Home Value in this Area
Purchase History
| Date | Buyer | Sale Price | Title Company |
|---|---|---|---|
| Pauls Safaa M | -- | None Listed On Document | |
| Pauls Safaa M | -- | None Listed On Document | |
| Safaa M And Eleni A Pauls Joint Trust | -- | Land Title | |
| Pauls Safaa | -- | Land Title | |
| Rinos Pauls Eleni | $115,000 | C E M Title Agency Inc | |
| Pauls Safaa | $84,000 | -- | |
| Al-Maleh Walid N | $65,000 | -- |
Source: Public Records
Mortgage History
| Date | Status | Borrower | Loan Amount |
|---|---|---|---|
| Open | Pauls Safaa M | $118,000 | |
| Closed | Pauls Safaa M | $118,000 |
Source: Public Records
Tax History
| Year | Tax Paid | Tax Assessment Tax Assessment Total Assessment is a certain percentage of the fair market value that is determined by local assessors to be the total taxable value of land and additions on the property. | Land | Improvement |
|---|---|---|---|---|
| 2025 | $2,502 | $109,200 | $0 | $0 |
| 2024 | $24 | $101,190 | $0 | $0 |
| 2023 | $2,321 | $91,110 | $0 | $0 |
| 2022 | $2,242 | $79,370 | $0 | $0 |
| 2021 | $2,281 | $75,910 | $0 | $0 |
| 2020 | $2,200 | $70,500 | $0 | $0 |
| 2019 | $2,121 | $65,240 | $0 | $0 |
| 2018 | $61 | $57,910 | $0 | $0 |
| 2017 | $2,127 | $54,120 | $10,090 | $44,030 |
| 2016 | $2,125 | $54,120 | $0 | $0 |
| 2015 | $1,197 | $44,550 | $0 | $0 |
| 2012 | -- | $39,270 | $0 | $0 |
Source: Public Records
Map
Nearby Homes
- 4611 E 13 Mile Rd
- 30987 Boewe Dr
- 4519 Reader Dr
- 5239 E 13 Mile Rd
- 4125 Derray Ct Unit 7
- 30520 Berghway Trail
- 30475 Berghway Trail
- 30055 Boewe Dr
- 4832 Muriel Dr
- 29900 N Grand Oaks Dr
- 4812 Berwyn Dr
- 3651 Chicago Rd
- 30802 Dell Ln
- 32416 Exeter Dr
- 29412 Woodpark Cir
- 32291 Ryan Rd
- 5441 Arden Ave
- 3090 Brysons Cove Dr
- 29542 van Laan Dr
- 5211 Streefkerk Dr
- 4635 E 13 Mile Rd
- 4560 Lutz Dr
- 4649 E 13 Mile Rd
- 4603 E 13 Mile Rd
- 4600 Lutz Dr
- 4548 Lutz Dr
- 4536 Lutz Dr
- 4667 E 13 Mile Rd
- 4593 E 13 Mile Rd
- 4624 Lutz Dr
- 4524 Lutz Dr
- 30997 Boewe Dr
- 4701 E 13 Mile Rd
- 4583 E 13 Mile Rd
- 31113 Blair Dr
- 4636 Lutz Dr
- 4512 Lutz Dr
- 4541 Lutz Dr
- 31112 Blair Dr
- 4670 E 13 Mile Rd
Your Personal Tour Guide
Ask me questions while you tour the home.