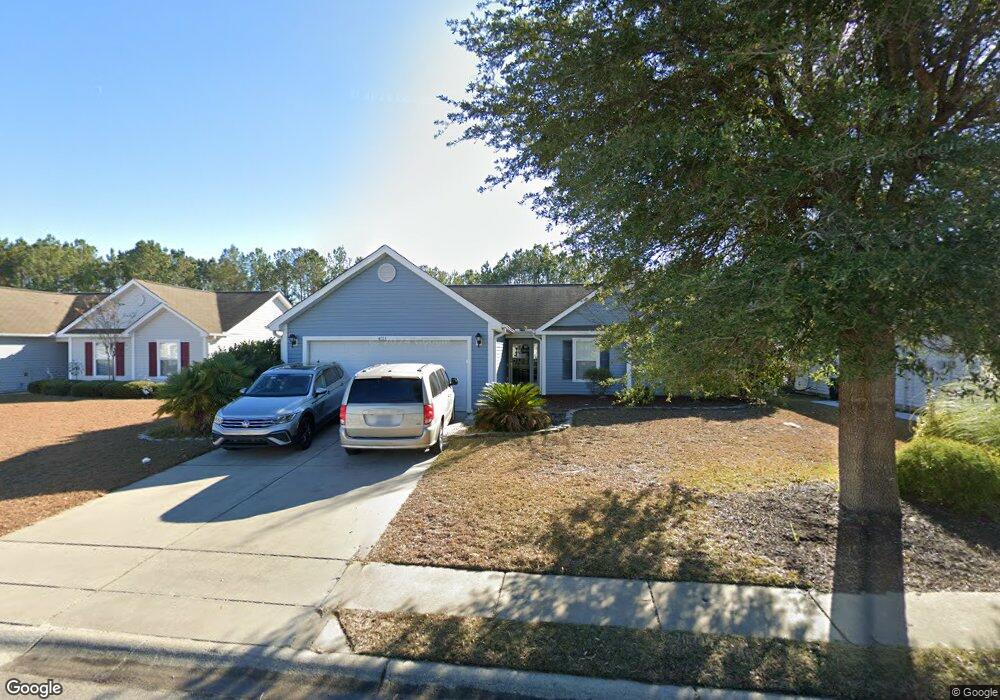
4623 E Walkerton Rd Unit Lot 164 Walker Wood Myrtle Beach, SC 29579
Estimated Value: $298,616 - $306,000
3
Beds
2
Baths
1,900
Sq Ft
$159/Sq Ft
Est. Value
About This Home
This home is located at 4623 E Walkerton Rd Unit Lot 164 Walker Wood, Myrtle Beach, SC 29579 and is currently estimated at $301,654, approximately $158 per square foot. 4623 E Walkerton Rd Unit Lot 164 Walker Wood is a home located in Horry County with nearby schools including Carolina Forest Elementary School, Ten Oaks Middle, and Carolina Forest High School.
Ownership History
Date
Name
Owned For
Owner Type
Purchase Details
Closed on
Jul 12, 2022
Sold by
Howard William B
Bought by
Matts Andrew C and Matts Melinda A
Current Estimated Value
Home Financials for this Owner
Home Financials are based on the most recent Mortgage that was taken out on this home.
Original Mortgage
$294,566
Outstanding Balance
$281,848
Interest Rate
5.78%
Mortgage Type
FHA
Estimated Equity
$19,806
Purchase Details
Closed on
Nov 20, 2009
Sold by
Wells Colleen Malloy
Bought by
Howard William B
Purchase Details
Closed on
Sep 21, 2006
Sold by
Beazer Homes Corp
Bought by
Wells Colleen Malloy
Home Financials for this Owner
Home Financials are based on the most recent Mortgage that was taken out on this home.
Original Mortgage
$100,000
Interest Rate
6.46%
Mortgage Type
Purchase Money Mortgage
Create a Home Valuation Report for This Property
The Home Valuation Report is an in-depth analysis detailing your home's value as well as a comparison with similar homes in the area
Home Values in the Area
Average Home Value in this Area
Purchase History
| Date | Buyer | Sale Price | Title Company |
|---|---|---|---|
| Matts Andrew C | $300,000 | -- | |
| Howard William B | $157,500 | -- | |
| Wells Colleen Malloy | $183,815 | None Available |
Source: Public Records
Mortgage History
| Date | Status | Borrower | Loan Amount |
|---|---|---|---|
| Open | Matts Andrew C | $294,566 | |
| Previous Owner | Wells Colleen Malloy | $100,000 |
Source: Public Records
Tax History Compared to Growth
Tax History
| Year | Tax Paid | Tax Assessment Tax Assessment Total Assessment is a certain percentage of the fair market value that is determined by local assessors to be the total taxable value of land and additions on the property. | Land | Improvement |
|---|---|---|---|---|
| 2024 | $1,206 | $12,146 | $5,002 | $7,144 |
| 2023 | $1,206 | $6,013 | $1,410 | $4,603 |
| 2021 | $469 | $6,579 | $1,551 | $5,028 |
| 2020 | $393 | $6,579 | $1,551 | $5,028 |
| 2019 | $393 | $6,579 | $1,551 | $5,028 |
| 2018 | $334 | $5,228 | $1,224 | $4,004 |
| 2017 | $319 | $5,228 | $1,224 | $4,004 |
| 2016 | -- | $5,228 | $1,224 | $4,004 |
| 2015 | $319 | $5,229 | $1,225 | $4,004 |
| 2014 | $296 | $5,229 | $1,225 | $4,004 |
Source: Public Records
Map
Nearby Homes
- 4603 E Walkerton Rd
- 4564 E Walkerton Rd
- 2081 Silvercrest Dr Unit 2F
- 2061 Silvercrest Dr Unit 7E
- 2057 Silvercrest Dr Unit 12F
- 2057 Silvercrest Dr Unit 12D
- 2033 Silvercrest Dr Unit 21B
- 238 Seabert Rd Unit 238
- 2013 Silvercrest Dr Unit 30H
- 2013 Silvercrest Dr Unit 30F
- 2005 Silvercrest Dr Unit G-32
- 2005 Silvercrest Dr Unit 32B
- 1057 Stanton Place
- 1024 Stanton Place Unit 1024
- 715 Pepperbush Dr
- 646 Uniola Dr
- 411 Seabert Rd
- 1303 Bermuda Grass Dr
- 228 Deep Blue Dr
- 394 Thistle Ln
- 4623 E Walkerton Rd
- 4619 E Walkerton Rd
- 4627 E Walkerton Rd
- 4615 E Walkerton Rd
- 4631 E Walkerton Rd
- 4611 E Walkerton Rd
- 4635 E Walkerton Rd
- 4620 E Walkerton Rd
- 4624 E Walkerton Rd
- 4624 E Walkerton Rd Unit Walkers Woods Lot 19
- 4612 E Walkerton Rd
- 4628 E Walkerton Rd
- 4632 E Walkerton Rd
- 4632 E Walkerton Rd Unit Walkers Wood
- 4639 E Walkerton Rd
- 4607 E Walkerton Rd
- 4600 E Walkerton Rd
- 4636 E Walkerton Rd
- 4643 E Walkerton Rd
- 4640 E Walkerton Rd