4623 Minard Rd W Bremerton, WA 98312
Estimated Value: $561,000 - $698,000
3
Beds
2
Baths
1,650
Sq Ft
$380/Sq Ft
Est. Value
About This Home
This home is located at 4623 Minard Rd W, Bremerton, WA 98312 and is currently estimated at $627,796, approximately $380 per square foot. 4623 Minard Rd W is a home located in Kitsap County with nearby schools including Sunnyslope Elementary School, Cedar Heights Middle School, and South Kitsap High School.
Ownership History
Date
Name
Owned For
Owner Type
Purchase Details
Closed on
Oct 21, 2008
Sold by
Holstrom Jeffrey Lynn and Holstrom Kim Marie
Bought by
Hagler Michael S and Hagler Kimberly C
Current Estimated Value
Home Financials for this Owner
Home Financials are based on the most recent Mortgage that was taken out on this home.
Original Mortgage
$284,150
Outstanding Balance
$184,079
Interest Rate
5.9%
Mortgage Type
VA
Estimated Equity
$443,717
Purchase Details
Closed on
Aug 17, 2001
Sold by
Barber Bradford K and Barber Irene N
Bought by
Holstrom Jeffrey Lynn and Holstrom Kim Marie
Home Financials for this Owner
Home Financials are based on the most recent Mortgage that was taken out on this home.
Original Mortgage
$156,051
Interest Rate
7.21%
Mortgage Type
FHA
Create a Home Valuation Report for This Property
The Home Valuation Report is an in-depth analysis detailing your home's value as well as a comparison with similar homes in the area
Home Values in the Area
Average Home Value in this Area
Purchase History
| Date | Buyer | Sale Price | Title Company |
|---|---|---|---|
| Hagler Michael S | $300,280 | Pacific Nw Title | |
| Holstrom Jeffrey Lynn | $158,500 | Transnation Title Insurance |
Source: Public Records
Mortgage History
| Date | Status | Borrower | Loan Amount |
|---|---|---|---|
| Open | Hagler Michael S | $284,150 | |
| Previous Owner | Holstrom Jeffrey Lynn | $156,051 |
Source: Public Records
Tax History Compared to Growth
Tax History
| Year | Tax Paid | Tax Assessment Tax Assessment Total Assessment is a certain percentage of the fair market value that is determined by local assessors to be the total taxable value of land and additions on the property. | Land | Improvement |
|---|---|---|---|---|
| 2026 | $3,797 | $431,090 | $90,860 | $340,230 |
| 2025 | $3,797 | $431,090 | $90,860 | $340,230 |
| 2024 | $3,682 | $431,090 | $90,860 | $340,230 |
| 2023 | $3,826 | $451,680 | $76,660 | $375,020 |
| 2022 | $4,004 | $396,990 | $69,750 | $327,240 |
| 2021 | $3,601 | $337,070 | $63,410 | $273,660 |
| 2020 | $3,377 | $306,690 | $57,640 | $249,050 |
| 2019 | $2,766 | $274,830 | $57,640 | $217,190 |
| 2018 | $2,855 | $238,300 | $73,410 | $164,890 |
| 2017 | $2,638 | $238,300 | $73,410 | $164,890 |
| 2016 | $2,769 | $229,420 | $70,590 | $158,830 |
| 2015 | $2,731 | $229,420 | $70,590 | $158,830 |
| 2014 | -- | $211,230 | $70,590 | $140,640 |
| 2013 | -- | $211,230 | $70,590 | $140,640 |
Source: Public Records
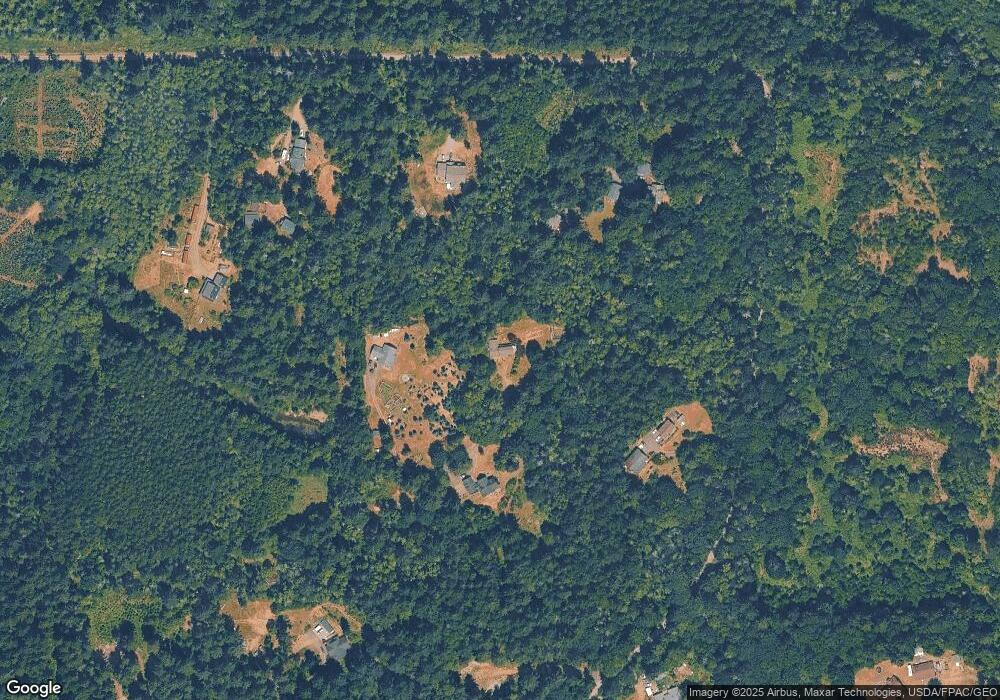
Map
Nearby Homes
- 10191 W Belfair Valley Rd
- 8942 McKenna Falls Rd W
- 6120 Crestner Dr SW
- 6102 Crestner Dr SW
- 6096 Crestner Dr SW
- 6080 Crestner Dr SW
- 6070 Crestner Dr SW
- 6054 Trace Dr SW
- 6041 Crestner Dr SW
- 6013 Trace Dr SW Unit 456
- 5894 Trace Dr SW
- 5763 Trace Dr SW
- 5733 Trace Dr SW
- 5846 SW 44th St
- 5131 Southgate Dr SW
- 6150 SW Rhododendron Dr
- 4850 Victory Dr SW
- 4520 Victory Place SW
- 13476 Tenino Dr W
- 6240 SW Old Clifton Rd
- 4611 Minard Rd W
- 4559 Minard Rd W
- 4619 Minard Rd W
- 4655 Minard Rd W
- 4627 Minard Rd W
- 4601 Minard Rd W
- 1 Minard Rd W
- 4545 Minard Rd W
- 4515 Minard Rd W
- 4959 Minard Rd W
- 5046 Minard Rd W
- 5123 Wilkinson Rd W
- 5172 Minard Rd W
- 5131 Wilkinson Rd W
- 0 L40 Minard Rd W
- 5 -xxx Minard Rd W
- 5 Minard Rd W
- 5209 Minard Rd W
- 4411 Minard Rd W