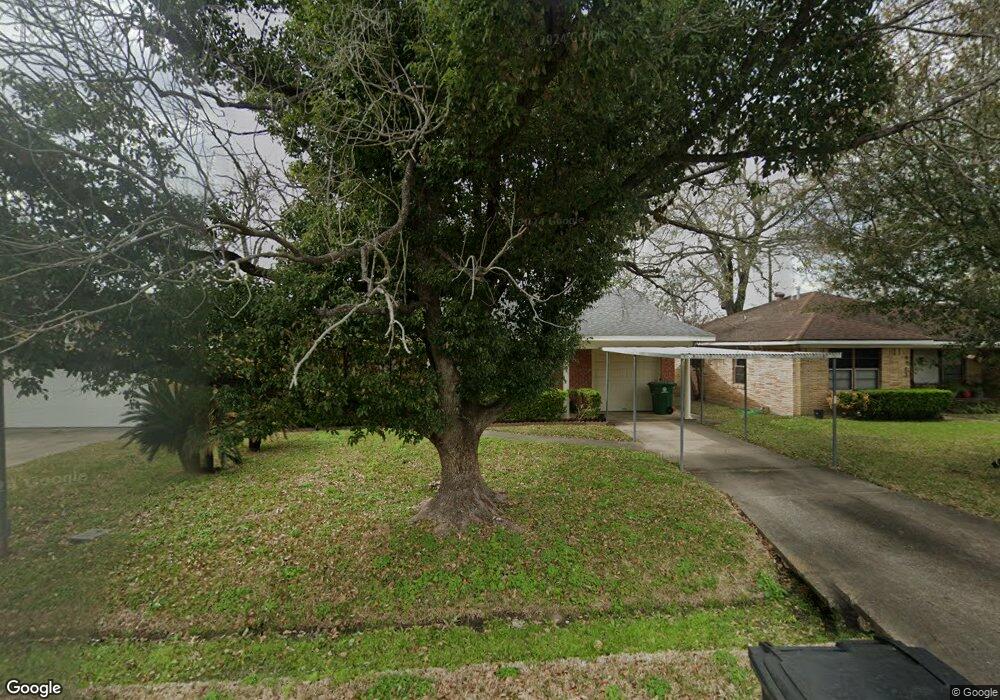
4623 Moore St Houston, TX 77009
Northside Village NeighborhoodEstimated Value: $285,000 - $369,000
2
Beds
1
Bath
1,208
Sq Ft
$259/Sq Ft
Est. Value
About This Home
This home is located at 4623 Moore St, Houston, TX 77009 and is currently estimated at $313,400, approximately $259 per square foot. 4623 Moore St is a home located in Harris County with nearby schools including Looscan Elementary School, Marshall Middle, and Northside High School.
Ownership History
Date
Name
Owned For
Owner Type
Purchase Details
Closed on
Sep 2, 2005
Sold by
Lee Hon Sai and Lee Qin Hao
Bought by
Olivares Eulogio P and Olivares Delia
Current Estimated Value
Home Financials for this Owner
Home Financials are based on the most recent Mortgage that was taken out on this home.
Original Mortgage
$92,700
Outstanding Balance
$49,376
Interest Rate
5.78%
Mortgage Type
Fannie Mae Freddie Mac
Estimated Equity
$264,024
Create a Home Valuation Report for This Property
The Home Valuation Report is an in-depth analysis detailing your home's value as well as a comparison with similar homes in the area
Home Values in the Area
Average Home Value in this Area
Purchase History
| Date | Buyer | Sale Price | Title Company |
|---|---|---|---|
| Olivares Eulogio P | -- | First American Title |
Source: Public Records
Mortgage History
| Date | Status | Borrower | Loan Amount |
|---|---|---|---|
| Open | Olivares Eulogio P | $92,700 |
Source: Public Records
Tax History Compared to Growth
Tax History
| Year | Tax Paid | Tax Assessment Tax Assessment Total Assessment is a certain percentage of the fair market value that is determined by local assessors to be the total taxable value of land and additions on the property. | Land | Improvement |
|---|---|---|---|---|
| 2025 | $68 | $307,456 | $218,103 | $89,353 |
| 2024 | $68 | $324,367 | $222,351 | $102,016 |
| 2023 | $68 | $313,434 | $222,351 | $91,083 |
| 2022 | $4,500 | $265,664 | $178,448 | $87,216 |
| 2021 | $4,330 | $201,302 | $118,965 | $82,337 |
| 2020 | $4,090 | $202,096 | $118,965 | $83,131 |
| 2019 | $3,885 | $198,436 | $113,300 | $85,136 |
| 2018 | $554 | $163,538 | $86,391 | $77,147 |
| 2017 | $3,209 | $163,538 | $86,391 | $77,147 |
| 2016 | $2,917 | $155,372 | $79,310 | $76,062 |
| 2015 | $554 | $135,673 | $56,650 | $79,023 |
| 2014 | $554 | $95,338 | $25,493 | $69,845 |
Source: Public Records
Map
Nearby Homes
- 4607 Cetti St
- 4803 Elser St
- 0 Frawley St
- 1105 Evelyn St
- 4614 Robertson St
- 1009 Canadian St
- 1017 Canadian St
- 1109 Moody St
- 4508 Robertson St
- 1415 & 1417 Amundsen St
- 1105 Amundsen St
- 4504 Robertson St
- 4909 Cochran St Unit 1
- 4718 Averill St
- 4814 Cochran St
- 4816 Cochran St
- 4331 Cetti St
- 612 Gale St
- 1012 Joyce St
- 4327 Robertson St