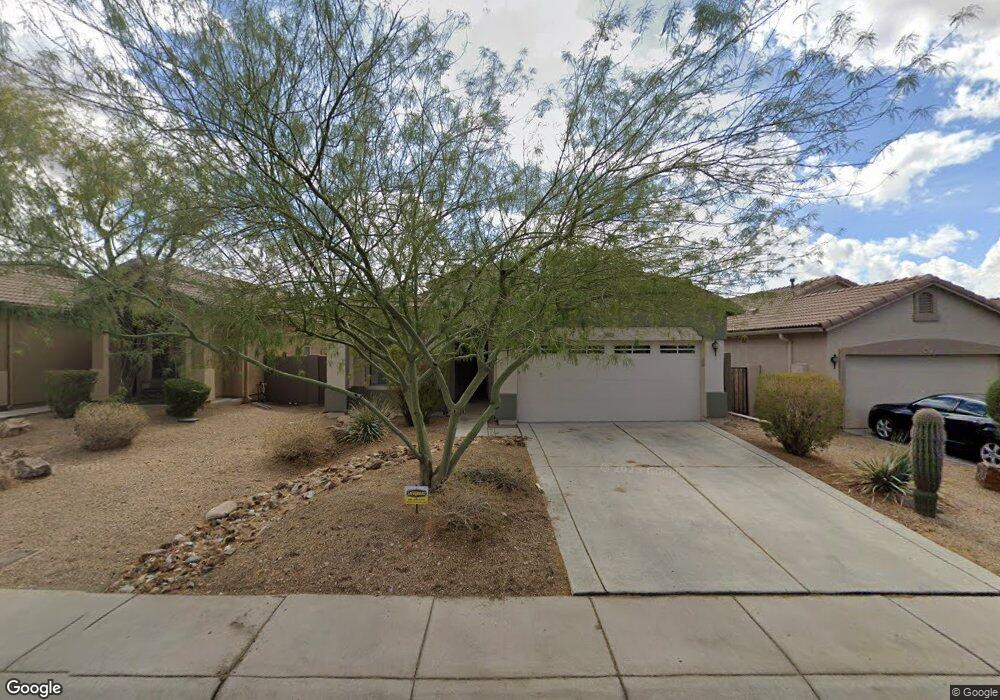
4623 W Crosswater Way Anthem, AZ 85086
Estimated Value: $362,702 - $446,000
3
Beds
2
Baths
1,426
Sq Ft
$287/Sq Ft
Est. Value
About This Home
This home is located at 4623 W Crosswater Way, Anthem, AZ 85086 and is currently estimated at $408,676, approximately $286 per square foot. 4623 W Crosswater Way is a home located in Maricopa County with nearby schools including Canyon Springs STEM Academy, Boulder Creek High School, and BASIS Phoenix North.
Ownership History
Date
Name
Owned For
Owner Type
Purchase Details
Closed on
Nov 10, 2020
Sold by
Watson John C and Watson Judith M
Bought by
Watson John C and Watson Judith M
Current Estimated Value
Purchase Details
Closed on
Mar 15, 2005
Sold by
Edwards Irv
Bought by
Watson John C and Watson Judith M
Home Financials for this Owner
Home Financials are based on the most recent Mortgage that was taken out on this home.
Original Mortgage
$159,000
Outstanding Balance
$80,555
Interest Rate
5.6%
Mortgage Type
New Conventional
Estimated Equity
$328,121
Purchase Details
Closed on
Feb 11, 2005
Sold by
Seacord Edwards Debby
Bought by
Edwards Irv
Home Financials for this Owner
Home Financials are based on the most recent Mortgage that was taken out on this home.
Original Mortgage
$159,000
Outstanding Balance
$80,555
Interest Rate
5.6%
Mortgage Type
New Conventional
Estimated Equity
$328,121
Create a Home Valuation Report for This Property
The Home Valuation Report is an in-depth analysis detailing your home's value as well as a comparison with similar homes in the area
Home Values in the Area
Average Home Value in this Area
Purchase History
| Date | Buyer | Sale Price | Title Company |
|---|---|---|---|
| Watson John C | -- | None Available | |
| Watson John C | $234,500 | Capital Title Agency Inc | |
| Edwards Irv | -- | North American Title Co | |
| Edwards Irv | $176,369 | North American Title Co |
Source: Public Records
Mortgage History
| Date | Status | Borrower | Loan Amount |
|---|---|---|---|
| Open | Watson John C | $159,000 | |
| Previous Owner | Edwards Irv | $141,050 |
Source: Public Records
Tax History Compared to Growth
Tax History
| Year | Tax Paid | Tax Assessment Tax Assessment Total Assessment is a certain percentage of the fair market value that is determined by local assessors to be the total taxable value of land and additions on the property. | Land | Improvement |
|---|---|---|---|---|
| 2025 | $1,971 | $19,472 | -- | -- |
| 2024 | $1,940 | $18,545 | -- | -- |
| 2023 | $1,940 | $30,350 | $6,070 | $24,280 |
| 2022 | $1,875 | $21,880 | $4,370 | $17,510 |
| 2021 | $1,925 | $19,960 | $3,990 | $15,970 |
| 2020 | $1,891 | $18,570 | $3,710 | $14,860 |
| 2019 | $1,837 | $17,470 | $3,490 | $13,980 |
| 2018 | $1,779 | $16,170 | $3,230 | $12,940 |
| 2017 | $1,721 | $14,950 | $2,990 | $11,960 |
| 2016 | $1,633 | $14,700 | $2,940 | $11,760 |
| 2015 | $1,463 | $13,920 | $2,780 | $11,140 |
Source: Public Records
Map
Nearby Homes
- 4516 W Fortune Dr
- 4524 W Stoneman Dr
- 42711 N 45th Dr
- 4405 W Heyerdahl Dr
- 4427 W Powell Dr
- 4535 W Cottontail Rd
- 4424 W Cottontail Rd
- 4423 W Magellan Dr
- 43303 N 44th Ave
- 4905 W Magellan Dr
- 43603 N 44th Ln
- 4714 W Lapenna Dr
- 3829 W Ashton Dr
- 43814 N 44th Ln
- 4308 W Kastler Ln Unit 2
- 4911 W Faull Dr
- 4718 W Culpepper Dr
- 3824 W Rushmore Dr Unit 20A
- 43709 N 50th Dr
- 42920 N Raleigh Ct Unit 20A
- 4627 W Crosswater Way Unit 1
- 4619 W Crosswater Way
- 4619 W Crosswater Way Unit Crosswa
- 4631 W Crosswater Way
- 4615 W Crosswater Way Unit 1
- 4622 W Fortune Dr
- 4618 W Fortune Dr Unit 1
- 4626 W Fortune Dr Unit 1
- 4635 W Crosswater Way Unit 1
- 4614 W Fortune Dr Unit 1
- 4630 W Fortune Dr
- 4624 W Crosswater Way
- 4628 W Crosswater Way
- 4620 W Crosswater Way
- 4639 W Crosswater Way
- 4634 W Fortune Dr Unit 1
- 4632 W Crosswater Way
- 4616 W Crosswater Way
- 4636 W Crosswater Way
- 4638 W Fortune Dr