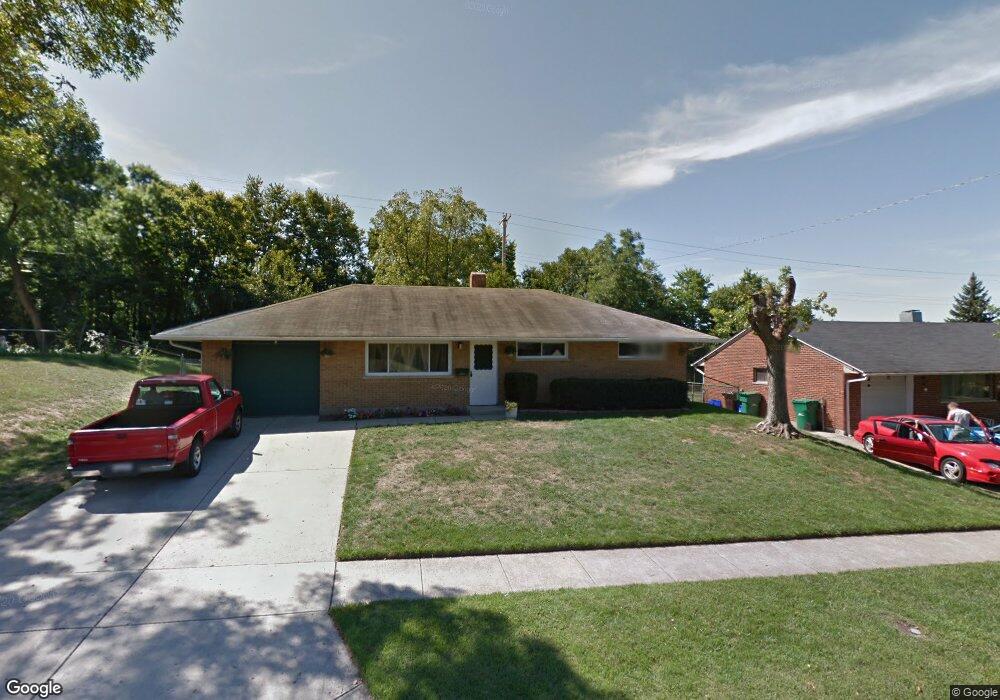
4624 Longfellow Ave Dayton, OH 45424
Estimated Value: $174,000 - $187,000
3
Beds
2
Baths
1,080
Sq Ft
$167/Sq Ft
Est. Value
About This Home
This home is located at 4624 Longfellow Ave, Dayton, OH 45424 and is currently estimated at $180,128, approximately $166 per square foot. 4624 Longfellow Ave is a home located in Montgomery County with nearby schools including Wayne High School and Pathway School of Discovery.
Ownership History
Date
Name
Owned For
Owner Type
Purchase Details
Closed on
Jan 9, 2002
Sold by
Wilson Jack L and Wilson Barbara G
Bought by
Young Ricky and Young Norma
Current Estimated Value
Home Financials for this Owner
Home Financials are based on the most recent Mortgage that was taken out on this home.
Original Mortgage
$89,095
Outstanding Balance
$35,333
Interest Rate
7.07%
Estimated Equity
$144,795
Purchase Details
Closed on
Dec 28, 2001
Sold by
Partnership Royal Oak Iii Family Limited
Bought by
Wilson Jack L and Wilson Barbara G
Home Financials for this Owner
Home Financials are based on the most recent Mortgage that was taken out on this home.
Original Mortgage
$89,095
Outstanding Balance
$35,333
Interest Rate
7.07%
Estimated Equity
$144,795
Purchase Details
Closed on
Mar 15, 1999
Sold by
Wilson Barbara G and Wilson Jack Louis
Bought by
Royal Oak Iii Family Ltd Partnership
Purchase Details
Closed on
Sep 13, 1996
Sold by
Brown Le Roy C
Bought by
Parker Wilson Barbara G
Create a Home Valuation Report for This Property
The Home Valuation Report is an in-depth analysis detailing your home's value as well as a comparison with similar homes in the area
Home Values in the Area
Average Home Value in this Area
Purchase History
| Date | Buyer | Sale Price | Title Company |
|---|---|---|---|
| Young Ricky | $86,500 | -- | |
| Wilson Jack L | -- | -- | |
| Royal Oak Iii Family Ltd Partnership | -- | -- | |
| Parker Wilson Barbara G | $73,000 | -- |
Source: Public Records
Mortgage History
| Date | Status | Borrower | Loan Amount |
|---|---|---|---|
| Open | Young Ricky | $89,095 |
Source: Public Records
Tax History
| Year | Tax Paid | Tax Assessment Tax Assessment Total Assessment is a certain percentage of the fair market value that is determined by local assessors to be the total taxable value of land and additions on the property. | Land | Improvement |
|---|---|---|---|---|
| 2025 | $2,261 | $42,260 | $10,010 | $32,250 |
| 2024 | $2,184 | $42,260 | $10,010 | $32,250 |
| 2023 | $2,184 | $42,260 | $10,010 | $32,250 |
| 2022 | $1,935 | $29,520 | $7,000 | $22,520 |
| 2021 | $1,964 | $29,520 | $7,000 | $22,520 |
| 2020 | $1,966 | $29,520 | $7,000 | $22,520 |
| 2019 | $1,848 | $24,510 | $7,000 | $17,510 |
| 2018 | $1,854 | $24,510 | $7,000 | $17,510 |
| 2017 | $1,842 | $24,510 | $7,000 | $17,510 |
| 2016 | $1,755 | $22,750 | $7,000 | $15,750 |
| 2015 | $1,733 | $22,750 | $7,000 | $15,750 |
| 2014 | $1,733 | $22,750 | $7,000 | $15,750 |
| 2012 | -- | $24,350 | $8,750 | $15,600 |
Source: Public Records
Map
Nearby Homes
- 4642 Kautz Dr
- 4507 Longfellow Ave
- 5100 Pocono Dr
- 5062 Nielson Ct
- 5314 Mariner Dr
- 4813 Nebraska Ave
- 4401 Nowak Ave
- 3484 Conifer Cir
- 5422 Pitcairn Rd
- 4750 Whitewood Ct
- 4581 Pennyston Ave
- 4867 Rittenhouse Dr
- 5669 Traymore Dr
- 4739 Strathaven Dr
- 5030 Renard Dr
- 5216 Lemoyne Dr
- 5662 Brandt Pike
- 4612 Passaic Ct
- 4130 Beech Tree Ct
- 5269 Buckner Dr
- 4618 Longfellow Ave
- 4630 Longfellow Ave
- 4612 Longfellow Ave
- 4625 Longfellow Ave
- 4619 Longfellow Ave
- 4636 Longfellow Ave
- 4613 Longfellow Ave
- 4631 Longfellow Ave
- 4606 Longfellow Ave
- 4607 Longfellow Ave
- 4642 Longfellow Ave
- 4624 Knobhill Dr
- 4635 Longfellow Ave
- 4618 Knobhill Dr
- 4998 Packard Dr
- 4612 Knobhill Dr
- 4630 Knobhill Dr
- 4601 Longfellow Ave
- 4636 Knobhill Dr
- 4606 Knobhill Dr
Your Personal Tour Guide
Ask me questions while you tour the home.