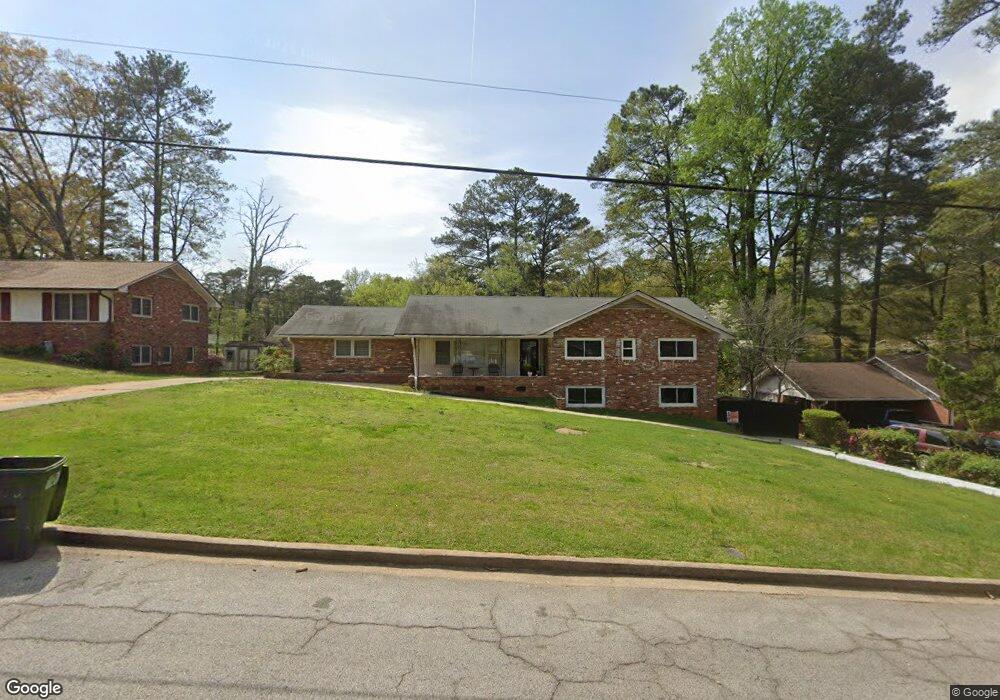
4625 Greensprings Rd Atlanta, GA 30337
Estimated Value: $226,795 - $292,000
3
Beds
2
Baths
1,540
Sq Ft
$168/Sq Ft
Est. Value
About This Home
This home is located at 4625 Greensprings Rd, Atlanta, GA 30337 and is currently estimated at $258,449, approximately $167 per square foot. 4625 Greensprings Rd is a home located in Fulton County with nearby schools including College Park Elementary School, Woodland Middle School, and The Main Street Academy.
Ownership History
Date
Name
Owned For
Owner Type
Purchase Details
Closed on
Apr 23, 2012
Sold by
Nash Alonzo A
Bought by
Nash Alonzo A and Grace Jarrell K
Current Estimated Value
Home Financials for this Owner
Home Financials are based on the most recent Mortgage that was taken out on this home.
Original Mortgage
$85,769
Outstanding Balance
$60,183
Interest Rate
4.25%
Mortgage Type
FHA
Estimated Equity
$198,266
Purchase Details
Closed on
Oct 7, 2008
Sold by
Baines Richard L and Baines Elaine M
Bought by
Tttn Llc
Purchase Details
Closed on
Jun 30, 1999
Sold by
First Union Nat Bk
Bought by
Mann Oatha D
Home Financials for this Owner
Home Financials are based on the most recent Mortgage that was taken out on this home.
Original Mortgage
$85,555
Interest Rate
7.43%
Mortgage Type
FHA
Purchase Details
Closed on
Jan 5, 1999
Sold by
Pasha Frederick
Bought by
First Union Nat Bk
Purchase Details
Closed on
Aug 31, 1994
Sold by
Thompson Alice
Bought by
Pasha Frederick
Create a Home Valuation Report for This Property
The Home Valuation Report is an in-depth analysis detailing your home's value as well as a comparison with similar homes in the area
Home Values in the Area
Average Home Value in this Area
Purchase History
| Date | Buyer | Sale Price | Title Company |
|---|---|---|---|
| Nash Alonzo A | -- | -- | |
| Nash Alonza A | $88,000 | -- | |
| Tttn Llc | $45,451 | -- | |
| Mann Oatha D | $85,900 | -- | |
| First Union Nat Bk | $99,180 | -- | |
| Pasha Frederick | $60,800 | -- |
Source: Public Records
Mortgage History
| Date | Status | Borrower | Loan Amount |
|---|---|---|---|
| Open | Nash Alonza A | $85,769 | |
| Closed | Nash Alonzo A | $85,769 | |
| Previous Owner | Mann Oatha D | $85,555 |
Source: Public Records
Tax History Compared to Growth
Tax History
| Year | Tax Paid | Tax Assessment Tax Assessment Total Assessment is a certain percentage of the fair market value that is determined by local assessors to be the total taxable value of land and additions on the property. | Land | Improvement |
|---|---|---|---|---|
| 2025 | $1,956 | $84,320 | $21,400 | $62,920 |
| 2023 | $1,853 | $65,640 | $20,480 | $45,160 |
| 2022 | $1,727 | $65,640 | $20,480 | $45,160 |
| 2021 | $1,439 | $53,040 | $12,560 | $40,480 |
| 2020 | $1,213 | $43,640 | $7,920 | $35,720 |
| 2019 | $542 | $42,920 | $7,800 | $35,120 |
| 2018 | $798 | $28,280 | $6,840 | $21,440 |
| 2017 | $794 | $27,200 | $6,560 | $20,640 |
| 2016 | $794 | $27,200 | $6,560 | $20,640 |
| 2015 | $1,140 | $27,200 | $6,560 | $20,640 |
| 2014 | $565 | $18,440 | $4,880 | $13,560 |
Source: Public Records
Map
Nearby Homes
- 4616 Greensprings Rd
- 0 Old National Hwy Unit 7636919
- 2586 Brandon Rd
- 4465 Kent Rd
- 4645 White City Rd
- 2999 Roosevelt Hwy
- 4357 Lafayette Ln
- 4204 Williamsburg Dr
- 6845 Old National Hwy
- 5057 Windsor Forrest Ln
- 5072 Windsor Forrest Ln
- 5074 Windsor Forrest Ln
- 4213 Janice Dr
- 2849 Windsor Forrest Ct
- 5149 Seashell Ln
- 2765 Live Oak Trail
- 4071 Williamsburg Dr
- 5157 Seashell Ln
- 4635 Greensprings Rd
- 4615 Greensprings Rd
- 2705 Winthrop Rd
- 4605 Greensprings Rd
- 4626 Greensprings Rd
- 4636 Greensprings Rd
- 2715 Winthrop Rd
- 4655 Greensprings Rd
- 4604 Winthrop Dr
- 2706 Winthrop Rd
- 4595 Greensprings Rd
- 4654 Greensprings Rd
- 4665 Greensprings Rd
- 4759 Winthrop Rd
- 2716 Winthrop Rd
- 4629 Hopewell Rd
- 4594 Winthrop Dr
- 4639 Hopewell Rd
- 4619 Hopewell Rd
- 4596 Greensprings Rd