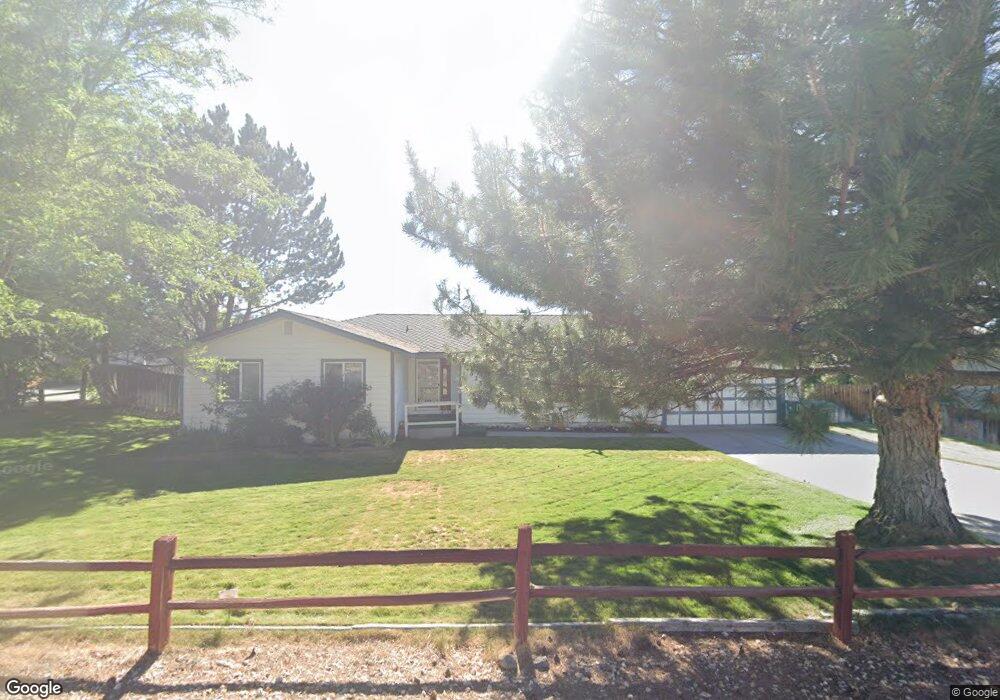
4625 Sleepy Hollow Dr Reno, NV 89502
Hidden Valley NeighborhoodEstimated Value: $628,000 - $708,000
4
Beds
2
Baths
1,850
Sq Ft
$356/Sq Ft
Est. Value
About This Home
This home is located at 4625 Sleepy Hollow Dr, Reno, NV 89502 and is currently estimated at $659,012, approximately $356 per square foot. 4625 Sleepy Hollow Dr is a home located in Washoe County with nearby schools including Hidden Valley Elementary School, Edward L Pine Middle School, and Earl Wooster High School.
Ownership History
Date
Name
Owned For
Owner Type
Purchase Details
Closed on
Feb 17, 2021
Sold by
Nye Katherine M
Bought by
The Katherine M Nye Living Trust and The Katherine M Nye Trust
Current Estimated Value
Create a Home Valuation Report for This Property
The Home Valuation Report is an in-depth analysis detailing your home's value as well as a comparison with similar homes in the area
Home Values in the Area
Average Home Value in this Area
Purchase History
| Date | Buyer | Sale Price | Title Company |
|---|---|---|---|
| The Katherine M Nye Living Trust | -- | None Available |
Source: Public Records
Tax History Compared to Growth
Tax History
| Year | Tax Paid | Tax Assessment Tax Assessment Total Assessment is a certain percentage of the fair market value that is determined by local assessors to be the total taxable value of land and additions on the property. | Land | Improvement |
|---|---|---|---|---|
| 2025 | $2,451 | $114,840 | $61,250 | $53,590 |
| 2024 | $2,451 | $107,322 | $52,605 | $54,717 |
| 2023 | $2,385 | $104,813 | $52,605 | $52,208 |
| 2022 | $2,318 | $85,282 | $41,300 | $43,982 |
| 2021 | $2,250 | $75,906 | $31,745 | $44,161 |
| 2020 | $2,180 | $76,412 | $31,745 | $44,667 |
| 2019 | $2,111 | $72,960 | $29,330 | $43,630 |
| 2018 | $2,053 | $65,129 | $22,085 | $43,044 |
| 2017 | $1,997 | $64,574 | $21,105 | $43,469 |
| 2016 | $1,939 | $65,585 | $20,860 | $44,725 |
| 2015 | $1,899 | $61,119 | $17,605 | $43,514 |
| 2014 | $1,850 | $56,174 | $13,930 | $42,244 |
| 2013 | -- | $55,763 | $13,930 | $41,833 |
Source: Public Records
Map
Nearby Homes
- 7702 S Southmoor Cir
- 3690 Sleepy Hollow Dr
- 3370 Shawnee Cir
- 3477 E Hidden Valley Dr Unit 3
- 5595 Saint Andrews Ct
- 2835 Parkway Dr
- 5705 Blue Hills Dr
- 5675 E Hidden Valley Dr
- 7385 Pembroke Dr
- 2265 Silky Sullivan Ln
- 6815 Prestwick Cir
- 5950 E Hidden Valley Dr
- 2100 Parkway Dr
- 5977 Hidden Highlands Dr
- 5979 Hidden Highlands Dr
- 6131 Mia Vista Dr
- 4841 W Hidden Valley Dr
- 5409 Greenview Ct
- 5984 Hidden Highlands Dr
- 5329 Mira Loma Dr
- 4465 Sleepy Hollow Dr
- 4775 Sleepy Hollow Dr
- 7831 S Southmoor Cir
- 7831 S Southmoor Cir Unit NV
- 4610 Sleepy Hollow Dr
- 7841 S Southmoor Cir
- 4875 Sleepy Hollow Dr
- 4385 Sleepy Hollow Dr
- 7801 S Southmoor Cir
- 4460 Sleepy Hollow Dr
- 4750 Sleepy Hollow Dr
- 7861 S Southmoor Cir
- 4350 Sleepy Hollow Dr
- 4870 Sleepy Hollow Dr
- 5420 N Scarsdale Cir
- 4975 Sleepy Hollow Dr
- 4255 Sleepy Hollow Dr
- 7871 S Southmoor Cir
- 7782 S Southmoor Cir
- 5400 N Scarsdale Cir