Estimated Value: $384,000 - $792,000
2
Beds
1
Bath
1,161
Sq Ft
$545/Sq Ft
Est. Value
About This Home
This home is located at 46252 SE Coalman Rd, Sandy, OR 97055 and is currently estimated at $632,170, approximately $544 per square foot. 46252 SE Coalman Rd is a home located in Clackamas County with nearby schools including Firwood Elementary School, Cedar Ridge Middle School, and Sandy High School.
Ownership History
Date
Name
Owned For
Owner Type
Purchase Details
Closed on
Sep 10, 2025
Sold by
Baughman Grant G
Bought by
Grant Baughman Living Trust and Baughman
Current Estimated Value
Purchase Details
Closed on
May 2, 2025
Sold by
Eagle View Acres Trust and Baughman Estella Eva
Bought by
Baughman Grant G
Purchase Details
Closed on
Sep 1, 2021
Sold by
Baughman Estella E and Baughman Grant G
Bought by
Baughman Estella Eva and Baughman Grant Gaylord
Purchase Details
Closed on
Dec 22, 2018
Sold by
Baughman Estella E and Baughman Grant G
Bought by
Baughman Estella Eva and Baughman Grant Gaylord
Purchase Details
Closed on
Mar 18, 2005
Sold by
Porter George C and Porter Joanne Sherry
Bought by
Baughman Estella E and Baughman Grant G
Purchase Details
Closed on
Nov 19, 2004
Sold by
Baughman Estella E and Baughman Grant G
Bought by
Baughman Estella E and Baughman Grant G
Create a Home Valuation Report for This Property
The Home Valuation Report is an in-depth analysis detailing your home's value as well as a comparison with similar homes in the area
Purchase History
| Date | Buyer | Sale Price | Title Company |
|---|---|---|---|
| Grant Baughman Living Trust | -- | None Listed On Document | |
| Baughman Grant G | -- | None Listed On Document | |
| Baughman Estella Eva | -- | None Available | |
| Baughman Estella Eva | -- | None Available | |
| Baughman Estella Eva | -- | None Available | |
| Baughman Estella Eva | -- | None Available | |
| Baughman Estella E | -- | Fidelity National Title Co | |
| Baughman Estella E | -- | None Available |
Source: Public Records
Tax History
| Year | Tax Paid | Tax Assessment Tax Assessment Total Assessment is a certain percentage of the fair market value that is determined by local assessors to be the total taxable value of land and additions on the property. | Land | Improvement |
|---|---|---|---|---|
| 2025 | $4,020 | $315,511 | -- | -- |
| 2024 | $3,443 | $302,290 | -- | -- |
| 2023 | $3,443 | $293,486 | -- | -- |
| 2022 | $3,255 | $284,938 | $0 | $0 |
| 2021 | $3,140 | $276,639 | $0 | $0 |
| 2020 | $3,055 | $268,582 | $0 | $0 |
| 2019 | $3,054 | $260,760 | $0 | $0 |
| 2018 | $2,967 | $253,165 | $0 | $0 |
| 2017 | $2,902 | $245,791 | $0 | $0 |
| 2016 | $2,799 | $238,632 | $0 | $0 |
| 2015 | $2,693 | $231,682 | $0 | $0 |
| 2014 | $2,561 | $224,934 | $0 | $0 |
Source: Public Records
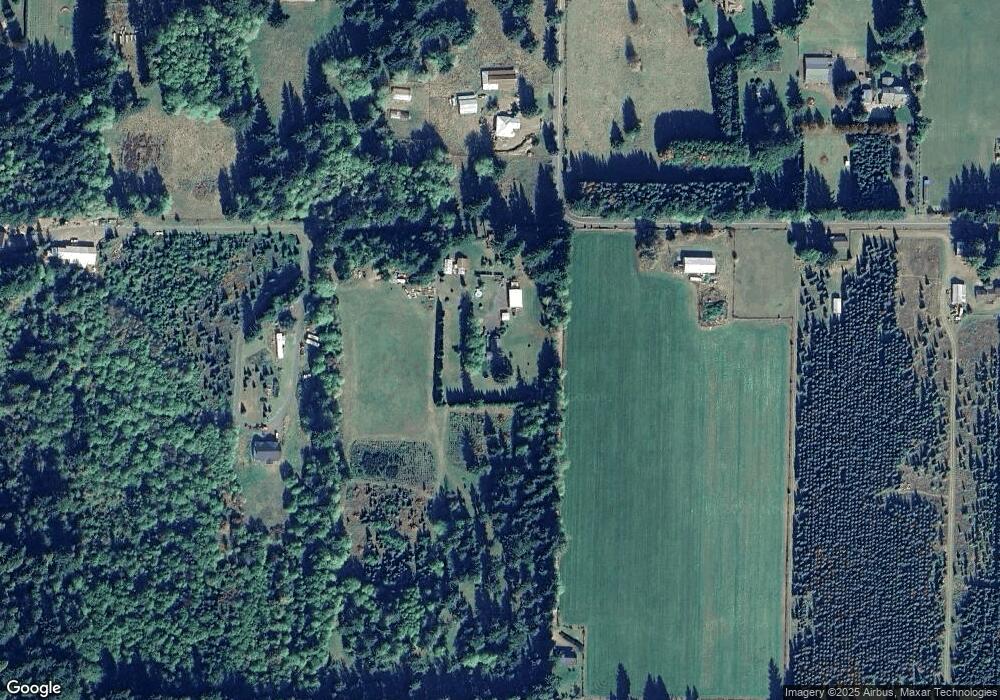
Map
Nearby Homes
- 45495 SE Coalman Rd
- 44871 SE Highway 26
- 44964 SE Coalman Rd
- 44434 SE Coalman Rd
- 20226 SE Veneer Ln
- 43940 SE Music Camp Rd
- 19090 Ochoco Ct Unit 71
- 41800 Deschutes Ave Unit 86A
- 18970 Crooked River St Unit 52
- 18935 Crooked River St Unit 49
- 18855 Crooked River St Unit 41
- 41860 Deschutes Ave Unit 12
- 18905 Crooked River St Unit 46
- 41865 Deschutes Ave Unit 61
- 41920 Deschutes Ave
- 41830 Deschutes Ave Unit 85A
- 41810 Deschutes Ave Unit 86B
- 18865 Crooked River St Unit 42
- 18845 Crooked River St Unit 40
- 41580 Metolius Ave Unit 23
- 46248 SE Coalman Rd
- 46256 SE Coalman Rd
- 46232 SE Coalman Rd
- 46230 SE Coalman Rd
- 46231 SE Coalman Rd
- 46585 SE Coalman Rd
- 46700 SE Coalman Rd
- 46242 SE Coalman Rd
- 46692 SE Coalman Rd
- 46227 SE Coalman Rd
- 46681 SE Coalman Rd
- 46006 SE Coalman Rd
- 45628 SE Coalman Rd
- 46225 SE Coalman Rd
- 45450 SE Coalman Rd
- 45660 SE Coalman Rd
- 46767 SE Coalman Rd
- 46734 SE Coalman Rd
- 46205 SE Coalman Rd
- 45656 SE Coalman Rd
Your Personal Tour Guide
Ask me questions while you tour the home.