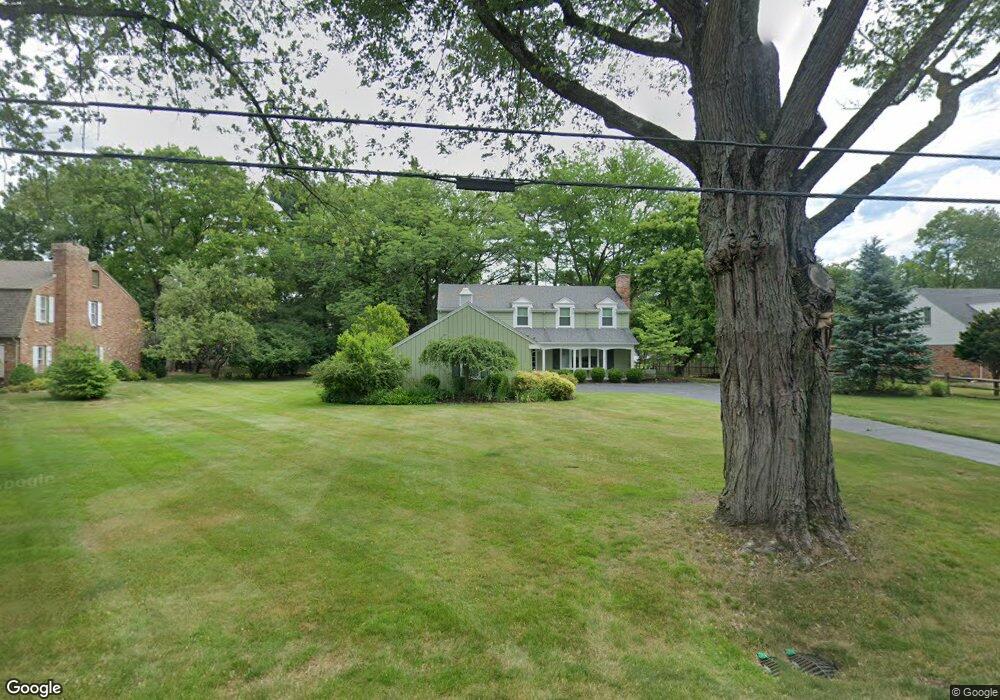
4626 Corey Rd Toledo, OH 43623
Estimated Value: $372,000 - $394,825
5
Beds
3
Baths
2,464
Sq Ft
$157/Sq Ft
Est. Value
About This Home
This home is located at 4626 Corey Rd, Toledo, OH 43623 and is currently estimated at $386,956, approximately $157 per square foot. 4626 Corey Rd is a home located in Lucas County with nearby schools including Whiteford Elementary School, Sylvania Arbor Hills Junior High School, and Sylvania Northview High School.
Ownership History
Date
Name
Owned For
Owner Type
Purchase Details
Closed on
Oct 26, 2009
Sold by
Hopkins Margaret M and Oneil Deborah A
Bought by
Hopkins Margaret M and Oneil Deborah A
Current Estimated Value
Purchase Details
Closed on
Jun 6, 2005
Sold by
Kozlowski T M and Kozlowski Lee M
Bought by
Hopkins Margaret M and Oneil Deborah A
Home Financials for this Owner
Home Financials are based on the most recent Mortgage that was taken out on this home.
Original Mortgage
$169,000
Outstanding Balance
$89,078
Interest Rate
5.91%
Mortgage Type
Fannie Mae Freddie Mac
Estimated Equity
$297,878
Purchase Details
Closed on
Mar 9, 2004
Sold by
Rogers Jean E
Bought by
Kozlowski T M and Kozlowski Lee M
Home Financials for this Owner
Home Financials are based on the most recent Mortgage that was taken out on this home.
Original Mortgage
$208,000
Interest Rate
5.78%
Mortgage Type
Purchase Money Mortgage
Purchase Details
Closed on
Oct 23, 1992
Sold by
Rogers B E and J E
Create a Home Valuation Report for This Property
The Home Valuation Report is an in-depth analysis detailing your home's value as well as a comparison with similar homes in the area
Home Values in the Area
Average Home Value in this Area
Purchase History
| Date | Buyer | Sale Price | Title Company |
|---|---|---|---|
| Hopkins Margaret M | -- | Attorney | |
| Hopkins Margaret M | -- | Attorney | |
| Hopkins Margaret M | $269,900 | Louisville Title Agency For | |
| Kozlowski T M | $260,000 | Midland | |
| -- | -- | -- |
Source: Public Records
Mortgage History
| Date | Status | Borrower | Loan Amount |
|---|---|---|---|
| Open | Hopkins Margaret M | $169,000 | |
| Closed | Kozlowski T M | $208,000 |
Source: Public Records
Tax History Compared to Growth
Tax History
| Year | Tax Paid | Tax Assessment Tax Assessment Total Assessment is a certain percentage of the fair market value that is determined by local assessors to be the total taxable value of land and additions on the property. | Land | Improvement |
|---|---|---|---|---|
| 2024 | $3,971 | $123,585 | $37,975 | $85,610 |
| 2023 | $6,608 | $88,130 | $32,410 | $55,720 |
| 2022 | $6,611 | $88,130 | $32,410 | $55,720 |
| 2021 | $6,771 | $88,130 | $32,410 | $55,720 |
| 2020 | $7,031 | $81,060 | $29,750 | $51,310 |
| 2019 | $6,772 | $81,060 | $29,750 | $51,310 |
| 2018 | $6,683 | $81,060 | $29,750 | $51,310 |
| 2017 | $7,143 | $77,910 | $28,875 | $49,035 |
| 2016 | $7,007 | $222,600 | $82,500 | $140,100 |
| 2015 | $6,606 | $222,600 | $82,500 | $140,100 |
| 2014 | $6,300 | $74,910 | $27,760 | $47,150 |
| 2013 | $6,300 | $74,910 | $27,760 | $47,150 |
Source: Public Records
Map
Nearby Homes
- 4824 Skelly Rd
- 4354 Corey Rd
- 5021 Rudgate Blvd
- 5004 Hunters Green Dr
- 5036 Valencia Dr
- 4226 Corey Rd
- 4832 Devilbiss Ct
- 5 Riverhills Ln
- 5025 Homerdale Ave
- 4550 Vineyard Rd
- 4806 Vineyard Rd
- 4557 Sadalia Rd
- 5679 Monroe St
- 5689 Corey Cove Unit 5689
- 5731 Corey Cove
- 230 Southbridge Rd
- 4801 Southbridge Rd
- 5202 Arbor Way
- 4726 Sutton Place
- 4943 Flanders Rd
- 4612 Corey Rd
- 4638 Corey Rd
- 5317 Bainbridge Rd
- 5311 Bainbridge Rd
- 4619 Corey Rd
- 5329 Bainbridge Rd
- 5351 Bainbridge Rd
- 4640 Farmington Rd
- 5322 Bristol Ct
- 4605 Corey Rd
- 5303 Bainbridge Rd
- 5308 Bristol Ct
- 4626 Farmington Rd
- 5308 Bainbridge Rd
- 4545 Corey Rd
- 4612 Farmington Rd
- 4627 Skelly Rd
- 4550 Farmington Rd
- 5320 Bainbridge Rd
- 5302 Bristol Ct