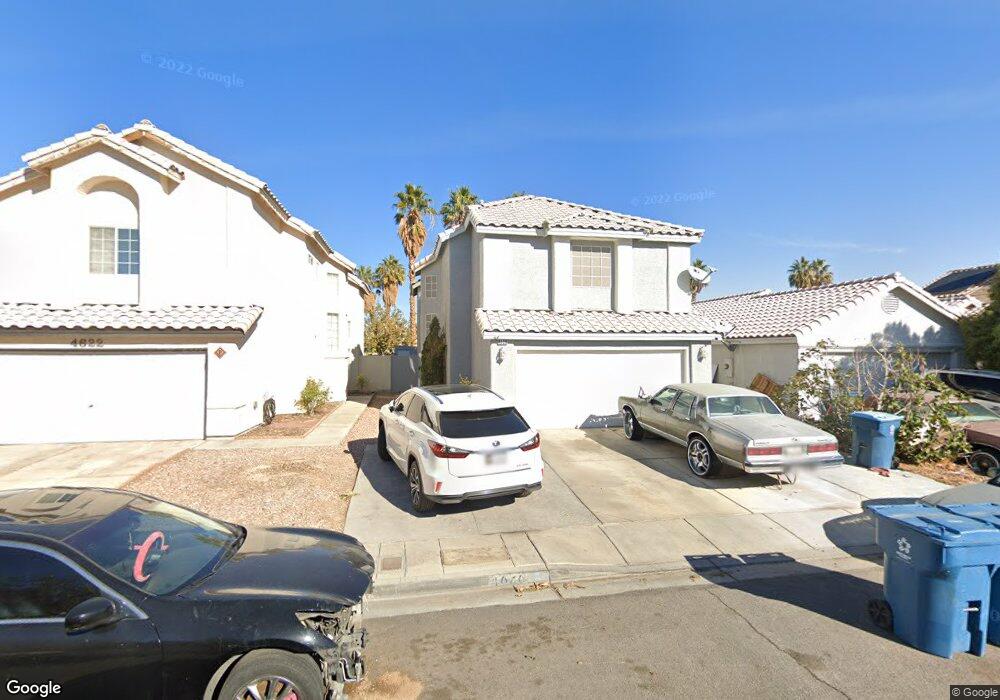
4626 Little Finch Ln Las Vegas, NV 89115
Estimated Value: $366,000 - $412,000
4
Beds
3
Baths
1,647
Sq Ft
$232/Sq Ft
Est. Value
About This Home
This home is located at 4626 Little Finch Ln, Las Vegas, NV 89115 and is currently estimated at $381,323, approximately $231 per square foot. 4626 Little Finch Ln is a home located in Clark County with nearby schools including Ruben P. Diaz Elementary School, Lomie G. Heard Elementary School, and Mario C. & Joanne Monaco Middle School.
Ownership History
Date
Name
Owned For
Owner Type
Purchase Details
Closed on
Jan 28, 1997
Sold by
Beller Development Company
Bought by
Smith Frank J and Smith Glenda
Current Estimated Value
Home Financials for this Owner
Home Financials are based on the most recent Mortgage that was taken out on this home.
Original Mortgage
$108,320
Outstanding Balance
$12,445
Interest Rate
7.74%
Mortgage Type
FHA
Estimated Equity
$368,878
Create a Home Valuation Report for This Property
The Home Valuation Report is an in-depth analysis detailing your home's value as well as a comparison with similar homes in the area
Home Values in the Area
Average Home Value in this Area
Purchase History
| Date | Buyer | Sale Price | Title Company |
|---|---|---|---|
| Smith Frank J | $110,500 | Fidelity National Title |
Source: Public Records
Mortgage History
| Date | Status | Borrower | Loan Amount |
|---|---|---|---|
| Open | Smith Frank J | $108,320 |
Source: Public Records
Tax History Compared to Growth
Tax History
| Year | Tax Paid | Tax Assessment Tax Assessment Total Assessment is a certain percentage of the fair market value that is determined by local assessors to be the total taxable value of land and additions on the property. | Land | Improvement |
|---|---|---|---|---|
| 2025 | $1,016 | $82,366 | $26,250 | $56,116 |
| 2024 | $987 | $82,366 | $26,250 | $56,116 |
| 2023 | $987 | $76,802 | $23,450 | $53,352 |
| 2022 | $958 | $68,059 | $19,250 | $48,809 |
| 2021 | $931 | $64,716 | $18,200 | $46,516 |
| 2020 | $900 | $64,390 | $18,200 | $46,190 |
| 2019 | $874 | $60,016 | $14,350 | $45,666 |
| 2018 | $849 | $54,240 | $10,500 | $43,740 |
| 2017 | $1,057 | $53,358 | $9,100 | $44,258 |
| 2016 | $1,057 | $42,883 | $7,700 | $35,183 |
| 2015 | $1,054 | $32,618 | $4,900 | $27,718 |
| 2014 | $972 | $25,763 | $3,500 | $22,263 |
Source: Public Records
Map
Nearby Homes
- 1654 Nesting Way
- 4609 Little Finch Ln
- 4637 Baby Bird Ln
- 4568 Little Finch Ln
- 4612 Supreme Ct
- 1611 Lovebird Ln Unit 4
- 1919 Verde Mirada Dr
- 26 Arcade Cir
- 1952 Metamora St
- 11 Bon Rea Cir
- 4639 Poetic Author Ave
- 4549 Morton Grove Ave
- 4487 E Lake Mead Blvd Unit 55
- 4487 E Lake Mead Blvd Unit 57
- 4363 Pittsfield St
- 4438 E Van Buren Ave
- 4928 E Monroe Ave
- 1112 Sandy Cove St
- 1009 Greenbank St
- 4321 Stockbridge St
- 4622 Little Finch Ln
- 4630 Little Finch Ln
- 4618 Little Finch Ln
- 4634 Little Finch Ln
- 4614 Little Finch Ln
- 4638 Little Finch Ln
- 4625 Little Wren Ln
- 4621 Little Wren Ln
- 4629 Little Wren Ln
- 4633 Little Wren Ln
- 4617 Little Wren Ln
- 4610 Little Finch Ln
- 4646 Little Finch Ln
- 4613 Little Wren Ln
- 4625 Little Finch Ln
- 4621 Little Finch Ln
- 4629 Little Finch Ln
- 4617 Little Finch Ln
- 4633 Little Finch Ln