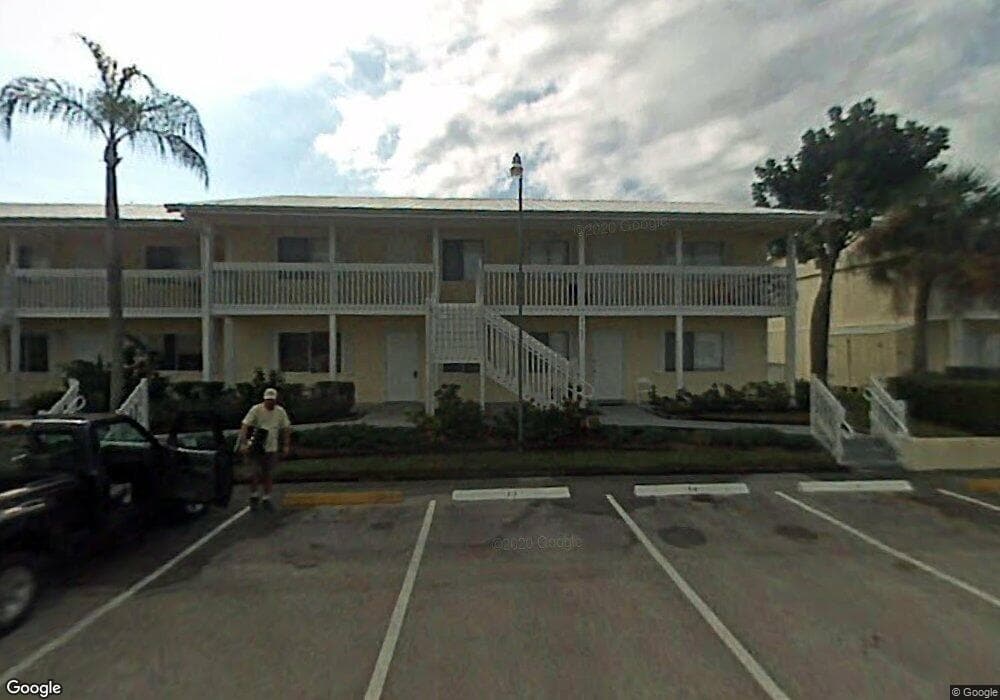
4627 Bayshore Dr Naples, FL 34112
East Naples NeighborhoodEstimated Value: $161,000 - $254,000
--
Bed
--
Bath
886
Sq Ft
$225/Sq Ft
Est. Value
About This Home
This home is located at 4627 Bayshore Dr, Naples, FL 34112 and is currently estimated at $199,777, approximately $225 per square foot. 4627 Bayshore Dr is a home located in Collier County with nearby schools including Avalon Elementary School, Naples High School, and East Naples Middle School.
Ownership History
Date
Name
Owned For
Owner Type
Purchase Details
Closed on
Nov 5, 2015
Sold by
Jacobs Stephen and Jacobs Kum
Bought by
Ab I-8 4627 Llc
Current Estimated Value
Purchase Details
Closed on
Nov 1, 2015
Bought by
Ab I-8 4627 Llc
Purchase Details
Closed on
Mar 22, 2013
Sold by
Federal Home Loan Mortgage Corporation
Bought by
Jacobs Kum and Jacobs Steve
Purchase Details
Closed on
Aug 21, 2012
Sold by
Aurora Loan Services Llc
Bought by
Federal Home Loan Mortgage Corporation
Purchase Details
Closed on
Aug 17, 2012
Sold by
Arce Oscar and Arce Ada
Bought by
Aurora Loan Services Llc
Purchase Details
Closed on
Jul 11, 2005
Sold by
Abaco Bay Development Llc
Bought by
Arce Oscar and Arce Ada
Home Financials for this Owner
Home Financials are based on the most recent Mortgage that was taken out on this home.
Original Mortgage
$34,000
Interest Rate
5.51%
Mortgage Type
Stand Alone Second
Create a Home Valuation Report for This Property
The Home Valuation Report is an in-depth analysis detailing your home's value as well as a comparison with similar homes in the area
Home Values in the Area
Average Home Value in this Area
Purchase History
| Date | Buyer | Sale Price | Title Company |
|---|---|---|---|
| Ab I-8 4627 Llc | -- | None Available | |
| Ab I-8 4627 Llc | $100 | -- | |
| Jacobs Kum | $50,400 | Attorney | |
| Federal Home Loan Mortgage Corporation | -- | Attorney | |
| Aurora Loan Services Llc | -- | None Available | |
| Arce Oscar | $170,000 | -- |
Source: Public Records
Mortgage History
| Date | Status | Borrower | Loan Amount |
|---|---|---|---|
| Previous Owner | Arce Oscar | $34,000 | |
| Previous Owner | Arce Oscar | $119,000 |
Source: Public Records
Tax History Compared to Growth
Tax History
| Year | Tax Paid | Tax Assessment Tax Assessment Total Assessment is a certain percentage of the fair market value that is determined by local assessors to be the total taxable value of land and additions on the property. | Land | Improvement |
|---|---|---|---|---|
| 2025 | $1,870 | $147,269 | -- | -- |
| 2024 | $1,756 | $133,881 | -- | -- |
| 2023 | $1,756 | $121,710 | $0 | $0 |
| 2022 | $1,623 | $110,645 | $0 | $0 |
| 2021 | $1,404 | $100,586 | $0 | $0 |
| 2020 | $1,292 | $91,442 | $0 | $0 |
| 2019 | $1,183 | $83,129 | $0 | $0 |
| 2018 | $1,097 | $75,572 | $0 | $0 |
| 2017 | $1,018 | $68,702 | $0 | $0 |
| 2016 | $959 | $62,456 | $0 | $0 |
| 2015 | $867 | $56,778 | $0 | $0 |
| 2014 | -- | $51,616 | $0 | $0 |
Source: Public Records
Map
Nearby Homes
- 4617 Bayshore Dr Unit 10
- 4627 Bayshore Dr Unit I-4
- 4629 Bayshore Dr Unit J3
- 4631 Bayshore Dr Unit L2
- 4623 Bayshore Dr Unit C2
- 4601 Bayshore Dr Unit A1
- 4633 Bayshore Dr Unit M3
- 4635 Bayshore Dr Unit P9
- 4720 Arboretum Cir Unit 102
- 4420 Botanical Place Cir Unit 104
- 4430 Botanical Place Cir Unit 101
- 4430 Botanical Place Cir Unit 305
- 4705 Arboretum Cir Unit 202
- 4713 Arboretum Cir Unit 202
- 4440 Botanical Place Cir Unit 102
- 4450 Botanical Place Cir Unit 406
- 4500 Botanical Place Cir Unit 206
- 4627 Bayshore Dr Unit I8
- 4627 Bayshore Dr
- 4627 Bayshore Dr Unit 16
- 4627 Bayshore Dr Unit I5
- 4627 Bayshore Dr
- 4627 Bayshore Dr Unit I3
- 4627 Bayshore Dr Unit I2
- 4627 Bayshore Dr Unit I1
- 4629 Bayshore Dr Unit J1
- 4629 Bayshore Dr Unit J5
- 4629 Bayshore Dr Unit JD
- 4629 Bayshore Dr Unit J7
- 4629 Bayshore Dr
- 4629 Bayshore Dr
- 4629 Bayshore Dr
- 4629 Bayshore Dr
- 4629 Bayshore Dr
- 4629 Bayshore Dr
- 4629 Bayshore Dr Unit J6
- 4629 Bayshore Dr Unit J4