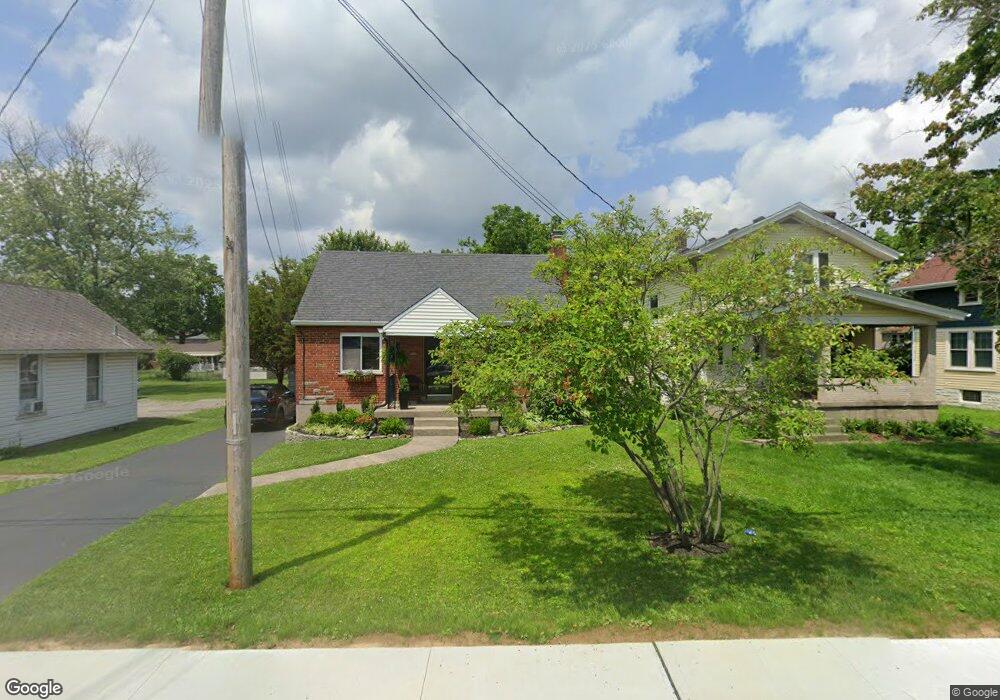
4628 Cooper Rd Cincinnati, OH 45242
Estimated Value: $274,000 - $364,000
3
Beds
2
Baths
1,524
Sq Ft
$218/Sq Ft
Est. Value
About This Home
This home is located at 4628 Cooper Rd, Cincinnati, OH 45242 and is currently estimated at $332,039, approximately $217 per square foot. 4628 Cooper Rd is a home located in Hamilton County with nearby schools including Edwin H Greene Intermediate Middle School, Sycamore Junior High School, and Sycamore High School.
Ownership History
Date
Name
Owned For
Owner Type
Purchase Details
Closed on
Nov 16, 2011
Sold by
Kirchmayer Deborah S and Sammons Deborah S
Bought by
Sammons Deborah S
Current Estimated Value
Purchase Details
Closed on
Jul 31, 1998
Sold by
Allen Sandra L and Dashley Cindy L
Bought by
Kirchmayer Deborah S
Home Financials for this Owner
Home Financials are based on the most recent Mortgage that was taken out on this home.
Original Mortgage
$86,000
Outstanding Balance
$16,225
Interest Rate
7.03%
Estimated Equity
$315,814
Purchase Details
Closed on
Aug 22, 1996
Sold by
Craft Steven B and Craft Brenda
Bought by
Allen Sandra L and Dashley Cindy L
Home Financials for this Owner
Home Financials are based on the most recent Mortgage that was taken out on this home.
Original Mortgage
$114,950
Interest Rate
8.47%
Create a Home Valuation Report for This Property
The Home Valuation Report is an in-depth analysis detailing your home's value as well as a comparison with similar homes in the area
Home Values in the Area
Average Home Value in this Area
Purchase History
| Date | Buyer | Sale Price | Title Company |
|---|---|---|---|
| Sammons Deborah S | -- | None Available | |
| Kirchmayer Deborah S | $110,000 | -- | |
| Allen Sandra L | $121,000 | Vintage Title Agenyc Inc |
Source: Public Records
Mortgage History
| Date | Status | Borrower | Loan Amount |
|---|---|---|---|
| Open | Kirchmayer Deborah S | $86,000 | |
| Previous Owner | Allen Sandra L | $114,950 |
Source: Public Records
Tax History
| Year | Tax Paid | Tax Assessment Tax Assessment Total Assessment is a certain percentage of the fair market value that is determined by local assessors to be the total taxable value of land and additions on the property. | Land | Improvement |
|---|---|---|---|---|
| 2025 | $3,565 | $82,044 | $30,576 | $51,468 |
| 2023 | $3,495 | $82,044 | $30,576 | $51,468 |
| 2022 | $3,144 | $61,394 | $11,722 | $49,672 |
| 2021 | $3,079 | $61,394 | $11,722 | $49,672 |
| 2020 | $3,101 | $61,394 | $11,722 | $49,672 |
| 2019 | $2,925 | $53,386 | $10,192 | $43,194 |
| 2018 | $2,800 | $53,386 | $10,192 | $43,194 |
| 2017 | $2,629 | $53,386 | $10,192 | $43,194 |
| 2016 | $2,532 | $49,641 | $10,497 | $39,144 |
| 2015 | $2,233 | $49,641 | $10,497 | $39,144 |
| 2014 | $2,241 | $49,641 | $10,497 | $39,144 |
| 2013 | $2,238 | $48,195 | $10,192 | $38,003 |
Source: Public Records
Map
Nearby Homes
- 4612 Miller Rd
- 9689 Cooper Ln
- 4539 Leslie Ave
- 4537 Leslie Ave
- 9216 Grandview Ave
- 4736 Alpine Ave
- 9299 Fidelis Dr
- 4326 Villa Dr
- 4648 Belleview Ave
- 4330 Villa Dr
- 6250 Cooper Rd
- 9001 Cherry St
- 9870 Timbers Dr
- 6399 Donjoy Dr
- 5700 Samstone Ct
- 4557 Elizabeth Place
- 10019 Zig Zag Rd
- 4230 Parkview Dr
- 4232 Parkview Dr
- 4234 Parkview Dr
- 4632 Cooper Rd
- 4620 Cooper Rd
- 4636 Cooper Rd
- 4616 Cooper Rd
- 4645 Miller Rd
- 4669 Miller Rd
- 4641 Miller Rd
- 4612 Cooper Rd
- 4658 Cooper Rd
- 4651 Miller Rd
- 4629 Miller Rd
- 4625 Cooper Rd
- 4619 Cooper Rd
- 4619 Cooper Rd Unit 1
- 4619 Cooper Rd Unit 2
- 4608 Cooper Rd
- 4609 Cooper Rd
- 9617 Conklin Rd
- 4631 Miller Rd
- 9544 Highland Ave
Your Personal Tour Guide
Ask me questions while you tour the home.