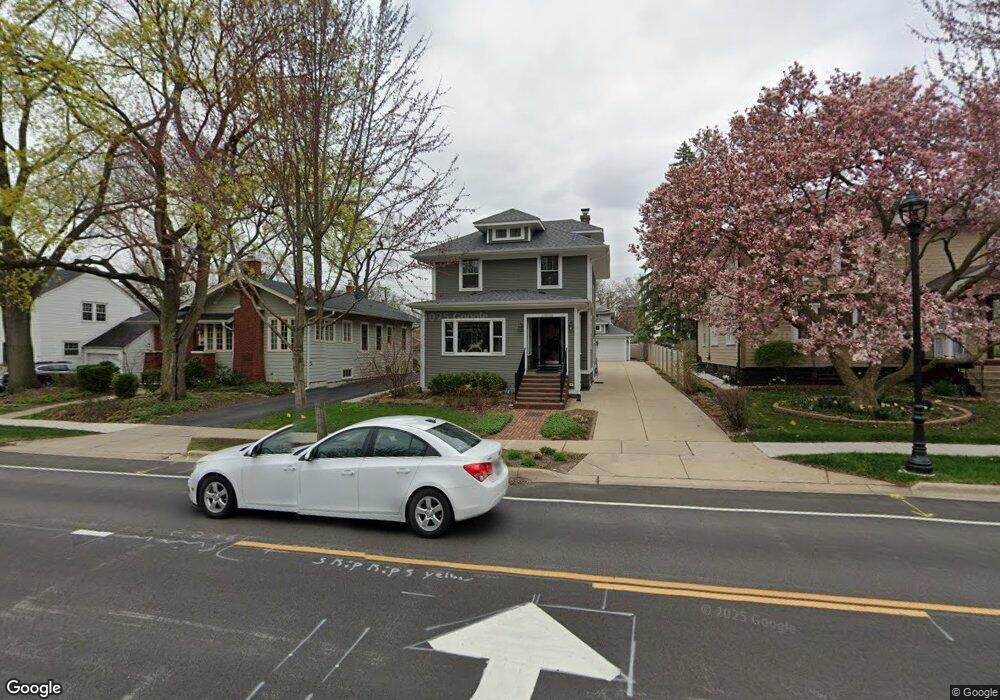
4628 Main St Downers Grove, IL 60515
Estimated Value: $445,115 - $637,000
--
Bed
--
Bath
1,397
Sq Ft
$393/Sq Ft
Est. Value
About This Home
This home is located at 4628 Main St, Downers Grove, IL 60515 and is currently estimated at $549,279, approximately $393 per square foot. 4628 Main St is a home located in DuPage County with nearby schools including Pierce Downer Elementary School, Herrick Middle School, and Downer Grove North High School.
Ownership History
Date
Name
Owned For
Owner Type
Purchase Details
Closed on
Jul 6, 2012
Sold by
Shields Robert J and Shields Cindy K
Bought by
Shields Robert J and Shields Cynthia A
Current Estimated Value
Purchase Details
Closed on
Nov 13, 2001
Sold by
Sullivan Cindy K
Bought by
Shields Robert J and Shields Cindy K
Home Financials for this Owner
Home Financials are based on the most recent Mortgage that was taken out on this home.
Original Mortgage
$77,000
Outstanding Balance
$29,918
Interest Rate
6.64%
Estimated Equity
$519,361
Purchase Details
Closed on
Jun 21, 2001
Sold by
Thornton Stuart
Bought by
Sullivan Cindy K
Home Financials for this Owner
Home Financials are based on the most recent Mortgage that was taken out on this home.
Original Mortgage
$75,000
Interest Rate
7.2%
Purchase Details
Closed on
Nov 29, 1999
Sold by
Fulco Frank P and Fulco Linda M
Bought by
Thornton Stuart
Home Financials for this Owner
Home Financials are based on the most recent Mortgage that was taken out on this home.
Original Mortgage
$100,000
Interest Rate
7%
Create a Home Valuation Report for This Property
The Home Valuation Report is an in-depth analysis detailing your home's value as well as a comparison with similar homes in the area
Home Values in the Area
Average Home Value in this Area
Purchase History
| Date | Buyer | Sale Price | Title Company |
|---|---|---|---|
| Shields Robert J | -- | None Available | |
| Shields Robert J | -- | Stewart Title Company | |
| Sullivan Cindy K | $317,500 | -- | |
| Thornton Stuart | $215,000 | Law Title Pick Up |
Source: Public Records
Mortgage History
| Date | Status | Borrower | Loan Amount |
|---|---|---|---|
| Open | Shields Robert J | $77,000 | |
| Closed | Sullivan Cindy K | $75,000 | |
| Previous Owner | Thornton Stuart | $100,000 | |
| Closed | Shields Robert J | $100,000 |
Source: Public Records
Tax History Compared to Growth
Tax History
| Year | Tax Paid | Tax Assessment Tax Assessment Total Assessment is a certain percentage of the fair market value that is determined by local assessors to be the total taxable value of land and additions on the property. | Land | Improvement |
|---|---|---|---|---|
| 2024 | $6,275 | $125,597 | $54,934 | $70,663 |
| 2023 | $5,912 | $115,460 | $50,500 | $64,960 |
| 2022 | $5,787 | $109,320 | $47,820 | $61,500 |
| 2021 | $5,412 | $108,080 | $47,280 | $60,800 |
| 2020 | $5,304 | $105,940 | $46,340 | $59,600 |
| 2019 | $5,120 | $101,650 | $44,460 | $57,190 |
| 2018 | $4,779 | $94,620 | $44,230 | $50,390 |
| 2017 | $4,463 | $88,470 | $42,550 | $45,920 |
| 2016 | $4,355 | $84,430 | $40,610 | $43,820 |
| 2015 | $4,281 | $79,440 | $38,210 | $41,230 |
| 2014 | $4,228 | $71,590 | $33,770 | $37,820 |
| 2013 | $4,141 | $71,250 | $33,610 | $37,640 |
Source: Public Records
Map
Nearby Homes
- 4533 Highland Ave
- 4731 Saratoga Ave
- 4512 Saratoga Ave
- 4900 Forest Ave Unit 108
- 4900 Forest Ave Unit 201
- 4900 Forest Ave Unit 308
- 4900 Forest Ave Unit 204
- 4900 Forest Ave Unit 205
- 4829 Linscott Ave
- 727 Grant St
- 965 Rogers St Unit 202
- 1219 Ogden Ave
- 4812 Oakwood Ave
- 4741 Montgomery Ave
- 841 Rogers St
- 624 Prairie Ave
- 4225 Highland Ave
- 4217 Main St
- 541 Chicago Ave
- 4532 Sherwood Ave