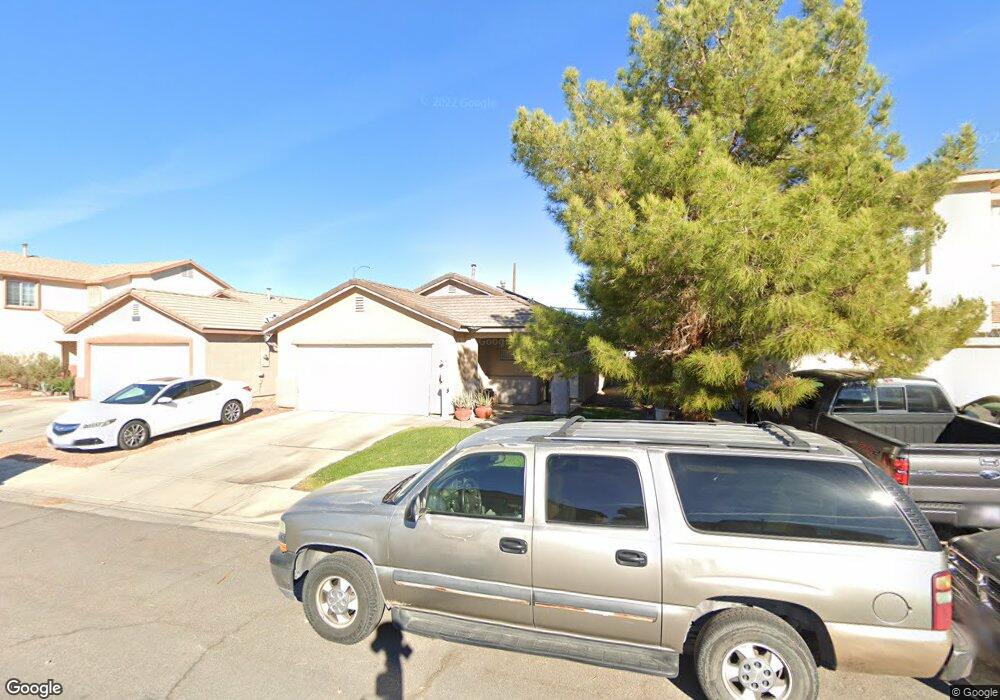
4628 Solar Eclipse Dr Las Vegas, NV 89115
Estimated Value: $343,115 - $363,000
3
Beds
2
Baths
1,245
Sq Ft
$282/Sq Ft
Est. Value
About This Home
This home is located at 4628 Solar Eclipse Dr, Las Vegas, NV 89115 and is currently estimated at $350,529, approximately $281 per square foot. 4628 Solar Eclipse Dr is a home located in Clark County with nearby schools including Ruben P. Diaz Elementary School, Mario C. & Joanne Monaco Middle School, and Sunrise Mountain High School.
Ownership History
Date
Name
Owned For
Owner Type
Purchase Details
Closed on
Nov 25, 2002
Sold by
Bobco Family Ltd Partnership
Bought by
Cardenas Irma
Current Estimated Value
Home Financials for this Owner
Home Financials are based on the most recent Mortgage that was taken out on this home.
Original Mortgage
$125,352
Outstanding Balance
$52,017
Interest Rate
6.28%
Mortgage Type
FHA
Estimated Equity
$298,512
Purchase Details
Closed on
Oct 11, 2002
Sold by
Love Jeannetta
Bought by
Bobco Family Ltd Partnership
Home Financials for this Owner
Home Financials are based on the most recent Mortgage that was taken out on this home.
Original Mortgage
$125,352
Outstanding Balance
$52,017
Interest Rate
6.28%
Mortgage Type
FHA
Estimated Equity
$298,512
Purchase Details
Closed on
Aug 28, 1997
Sold by
Greystone Homes Inc
Bought by
Love Jeannetta
Home Financials for this Owner
Home Financials are based on the most recent Mortgage that was taken out on this home.
Original Mortgage
$93,013
Interest Rate
7.43%
Create a Home Valuation Report for This Property
The Home Valuation Report is an in-depth analysis detailing your home's value as well as a comparison with similar homes in the area
Home Values in the Area
Average Home Value in this Area
Purchase History
| Date | Buyer | Sale Price | Title Company |
|---|---|---|---|
| Cardenas Irma | $130,000 | Fidelity National Title | |
| Bobco Family Ltd Partnership | $101,000 | -- | |
| Love Jeannetta | $96,000 | Nevada Title Company |
Source: Public Records
Mortgage History
| Date | Status | Borrower | Loan Amount |
|---|---|---|---|
| Open | Cardenas Irma | $125,352 | |
| Previous Owner | Love Jeannetta | $93,013 |
Source: Public Records
Tax History
| Year | Tax Paid | Tax Assessment Tax Assessment Total Assessment is a certain percentage of the fair market value that is determined by local assessors to be the total taxable value of land and additions on the property. | Land | Improvement |
|---|---|---|---|---|
| 2026 | $1,171 | $69,804 | $26,600 | $43,204 |
| 2025 | $1,084 | $70,359 | $26,250 | $44,109 |
| 2024 | $1,005 | $70,359 | $26,250 | $44,109 |
| 2023 | $1,005 | $65,330 | $23,450 | $41,880 |
| 2022 | $930 | $57,618 | $19,250 | $38,368 |
| 2021 | $862 | $54,708 | $18,200 | $36,508 |
| 2020 | $797 | $54,502 | $18,200 | $36,302 |
| 2019 | $747 | $50,196 | $14,350 | $35,846 |
| 2018 | $713 | $44,988 | $10,500 | $34,488 |
| 2017 | $1,291 | $44,023 | $9,100 | $34,923 |
| 2016 | $669 | $35,509 | $7,700 | $27,809 |
| 2015 | $666 | $26,856 | $4,900 | $21,956 |
| 2014 | $645 | $21,349 | $3,500 | $17,849 |
Source: Public Records
Map
Nearby Homes
- 1813 Classic Novel St
- 4609 Little Finch Ln
- 1933 Metamora St
- 4487 E Lake Mead Blvd Unit 32
- 4487 E Lake Mead Blvd Unit 55
- 4487 E Lake Mead Blvd Unit 20
- 4796 Nova Ln
- 4526 Morton Grove Ave
- 4260 Lunar Lullaby Ave
- 4363 Pittsfield St
- 1723 N Lamont St
- 1721 N Lamont St
- 4182 E Lake Mead Blvd
- 11 Bon Rea Cir
- 1432 Dresden Doll St
- 4650 E Lake Mead Blvd Unit 123
- 4650 E Lake Mead Blvd Unit 120
- 4650 E Lake Mead Blvd Unit 95
- 4650 E Lake Mead Blvd Unit 65
- 4650 E Lake Mead Blvd Unit 20
- 4620 Solar Eclipse Dr
- 4634 Solar Eclipse Dr Unit 1
- 4612 Solar Eclipse Dr
- 4612 Solar Eclipse Dr Unit na
- 4642 Solar Eclipse Dr
- 4608 Solar Eclipse Dr
- 4648 Solar Eclipse Dr
- 4627 Solar Eclipse Dr
- 4619 Solar Eclipse Dr
- 4633 Solar Eclipse Dr
- 4620 Kell Ln
- 4604 Solar Eclipse Dr
- 4652 Solar Eclipse Dr
- 4641 Solar Eclipse Dr
- 4611 Solar Eclipse Dr
- 4607 Solar Eclipse Dr
- 4647 Solar Eclipse Dr
- 4656 Solar Eclipse Dr Unit 1
- 4594 Solar Eclipse Dr
- 1805 Classic Novel St
Your Personal Tour Guide
Ask me questions while you tour the home.