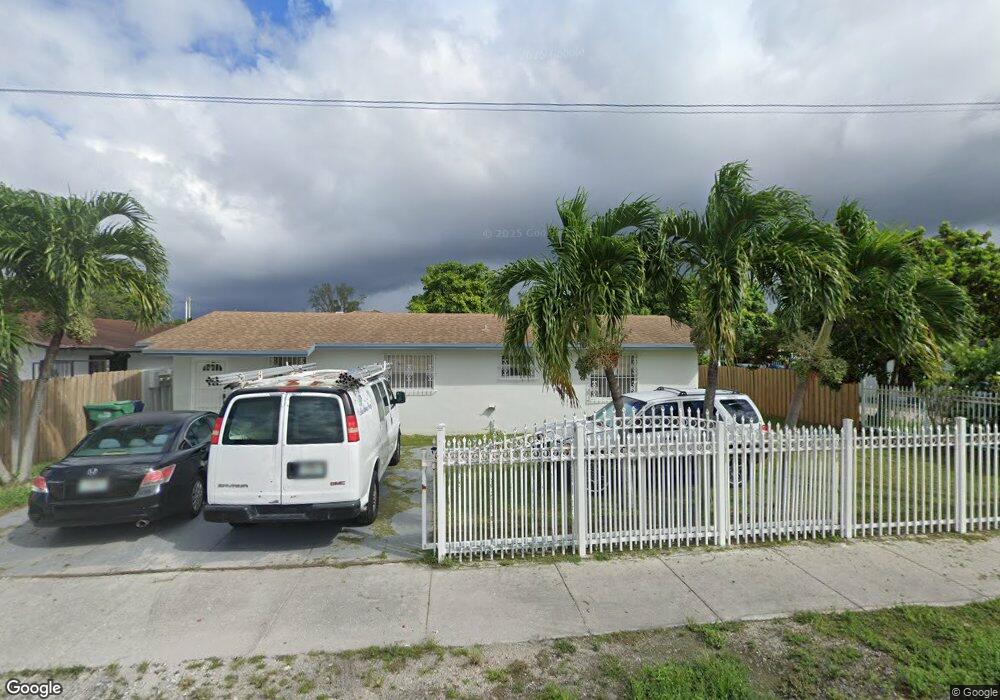
4629 NW 156th St Opa Locka, FL 33054
Palmetto Lakes NeighborhoodEstimated Value: $388,000 - $473,000
3
Beds
2
Baths
1,204
Sq Ft
$357/Sq Ft
Est. Value
About This Home
This home is located at 4629 NW 156th St, Opa Locka, FL 33054 and is currently estimated at $430,354, approximately $357 per square foot. 4629 NW 156th St is a home located in Miami-Dade County with nearby schools including Carol City Elementary School, Carol City Middle School, and Hialeah-Miami Lakes Senior High School.
Ownership History
Date
Name
Owned For
Owner Type
Purchase Details
Closed on
May 16, 2007
Sold by
Gaviria Conrado and Jaramillo Alba
Bought by
Jaramillo Alba
Current Estimated Value
Purchase Details
Closed on
Sep 6, 2001
Sold by
Rps Investments C
Bought by
Gaviria Conrado and Gaviria Alba J
Purchase Details
Closed on
May 22, 2001
Sold by
Federal National Mortgage Assn C
Bought by
Rps Investments Inc
Purchase Details
Closed on
Dec 27, 2000
Sold by
Clerk Of The Court
Bought by
Federal National Mortgage Association
Purchase Details
Closed on
Feb 7, 1996
Sold by
Rosado Fernando
Bought by
Rosado Fernando and Reyes Oriol
Purchase Details
Closed on
Mar 7, 1995
Sold by
Chevez Mariano and Chevez Maria E
Bought by
Rosado Fernando
Home Financials for this Owner
Home Financials are based on the most recent Mortgage that was taken out on this home.
Original Mortgage
$92,150
Interest Rate
8.81%
Create a Home Valuation Report for This Property
The Home Valuation Report is an in-depth analysis detailing your home's value as well as a comparison with similar homes in the area
Home Values in the Area
Average Home Value in this Area
Purchase History
| Date | Buyer | Sale Price | Title Company |
|---|---|---|---|
| Jaramillo Alba | -- | Ej Title & Escrow | |
| Gaviria Conrado | $112,000 | -- | |
| Rps Investments Inc | $106,833 | -- | |
| Federal National Mortgage Association | -- | -- | |
| Rosado Fernando | $100 | -- | |
| Rosado Fernando | $97,000 | -- |
Source: Public Records
Mortgage History
| Date | Status | Borrower | Loan Amount |
|---|---|---|---|
| Previous Owner | Rosado Fernando | $92,150 |
Source: Public Records
Tax History Compared to Growth
Tax History
| Year | Tax Paid | Tax Assessment Tax Assessment Total Assessment is a certain percentage of the fair market value that is determined by local assessors to be the total taxable value of land and additions on the property. | Land | Improvement |
|---|---|---|---|---|
| 2025 | $1,457 | $63,434 | -- | -- |
| 2024 | $1,300 | $61,647 | -- | -- |
| 2023 | $1,300 | $59,852 | $0 | $0 |
| 2022 | $1,243 | $58,109 | $0 | $0 |
| 2021 | $1,218 | $56,417 | $0 | $0 |
| 2020 | $1,216 | $55,639 | $0 | $0 |
| 2019 | $1,211 | $54,389 | $0 | $0 |
| 2018 | $1,173 | $53,375 | $0 | $0 |
| 2017 | $1,177 | $52,278 | $0 | $0 |
| 2016 | $1,127 | $51,203 | $0 | $0 |
| 2015 | $1,134 | $50,848 | $0 | $0 |
| 2014 | $1,146 | $50,445 | $0 | $0 |
Source: Public Records
Map
Nearby Homes
- 15801 NW 47th Ave
- 15803 NW 47th Ave
- 15660 NW 41st Ave
- 16600 NW 44th Ct
- 43xx NW 167th St
- 15730 NW 38th Place
- 4510 NW 168th Terrace
- 4420 NW 168th Terrace
- 4845 NW 169th St
- 16011 NW 38th Ct
- 4390 NW 171st St
- 17210 NW 47th Ave
- 16320 NW 37th Ave
- 16350 NW 37th Ave
- 17130 NW 51st Place
- 17320 NW 47th Ave
- 17211 NW 43rd Ave
- 16815 NW 38th Ct
- 4410 NW 174th Dr
- 4932 NW 173rd Dr
- 15601 NW 47th Ave Unit B
- 4619 NW 156th St
- 15611 NW 47th Ave
- 4605 NW 156th St
- 15707 NW 47th Ave
- 4545 NW 156th St
- 15709 NW 47th Ave
- 15711 NW 47th Ave
- 4537 NW 156th St Unit B
- 15713 NW 47th Ave
- 15721 NW 47th Ave
- 15706 NW 45th Ave
- 15740 NW 45th Ave Unit H
- 15723 NW 47th Ave
- 4505 NW 156th St
- 15708 NW 45th Ave
- 15616 NW 45th Ave
- 4535 NW 156th St Unit A
- 15600 NW 45th Ave Unit B
- 15731 NW 47th Ave