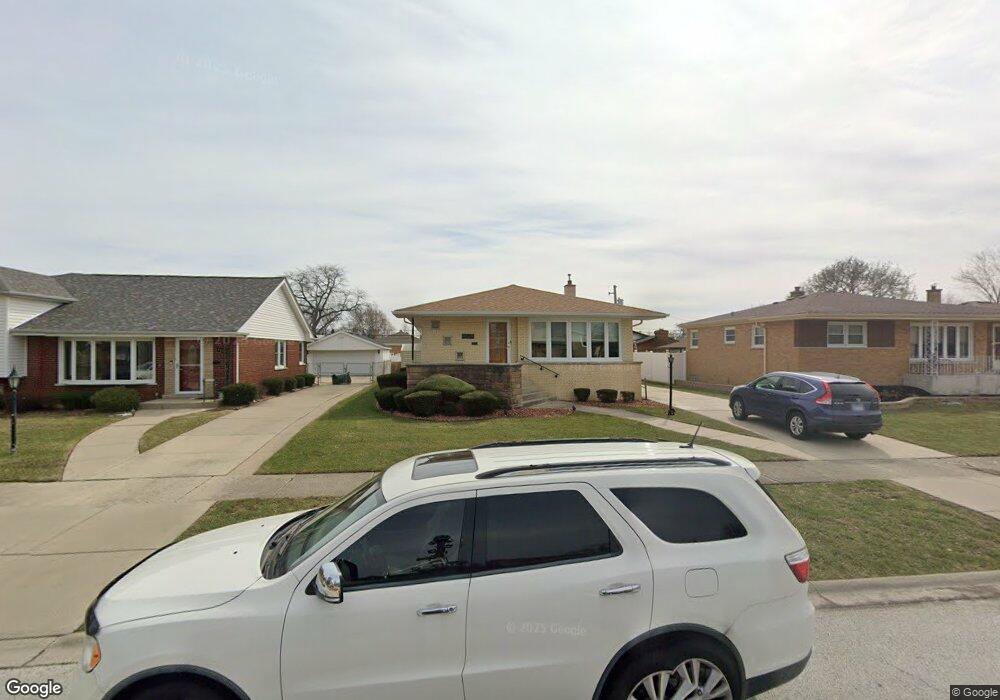
4629 W 100th St Oak Lawn, IL 60453
Estimated Value: $343,000 - $362,000
3
Beds
2
Baths
1,462
Sq Ft
$240/Sq Ft
Est. Value
About This Home
This home is located at 4629 W 100th St, Oak Lawn, IL 60453 and is currently estimated at $350,953, approximately $240 per square foot. 4629 W 100th St is a home located in Cook County with nearby schools including Sward Elementary School, Kolmar Avenue Elementary School, and J Covington Elementary School.
Ownership History
Date
Name
Owned For
Owner Type
Purchase Details
Closed on
Aug 5, 2024
Sold by
Rendell Patricia and Walsh Kevin
Bought by
Kevin Walsh & Patricia Walsh Trust and Walsh
Current Estimated Value
Purchase Details
Closed on
Jul 9, 2012
Sold by
Walsh Kevin and Rendell Patricia
Bought by
Walsh Kevin and Walsh Patricia
Home Financials for this Owner
Home Financials are based on the most recent Mortgage that was taken out on this home.
Original Mortgage
$166,030
Interest Rate
3.77%
Mortgage Type
New Conventional
Purchase Details
Closed on
Nov 18, 2003
Sold by
Standard Bank & Trust Co
Bought by
Walsh Kevin and Rendell Patricia
Home Financials for this Owner
Home Financials are based on the most recent Mortgage that was taken out on this home.
Original Mortgage
$178,900
Interest Rate
6.1%
Mortgage Type
Unknown
Create a Home Valuation Report for This Property
The Home Valuation Report is an in-depth analysis detailing your home's value as well as a comparison with similar homes in the area
Home Values in the Area
Average Home Value in this Area
Purchase History
| Date | Buyer | Sale Price | Title Company |
|---|---|---|---|
| Kevin Walsh & Patricia Walsh Trust | -- | None Listed On Document | |
| Walsh Kevin | -- | Citywide Title Corporation | |
| Walsh Kevin | $230,000 | -- |
Source: Public Records
Mortgage History
| Date | Status | Borrower | Loan Amount |
|---|---|---|---|
| Previous Owner | Walsh Kevin | $166,030 | |
| Previous Owner | Walsh Kevin | $178,900 |
Source: Public Records
Tax History Compared to Growth
Tax History
| Year | Tax Paid | Tax Assessment Tax Assessment Total Assessment is a certain percentage of the fair market value that is determined by local assessors to be the total taxable value of land and additions on the property. | Land | Improvement |
|---|---|---|---|---|
| 2024 | $6,758 | $27,000 | $5,445 | $21,555 |
| 2023 | $6,497 | $27,000 | $5,445 | $21,555 |
| 2022 | $6,497 | $22,638 | $4,719 | $17,919 |
| 2021 | $6,385 | $22,637 | $4,719 | $17,918 |
| 2020 | $6,478 | $22,637 | $4,719 | $17,918 |
| 2019 | $7,306 | $22,486 | $4,356 | $18,130 |
| 2018 | $7,031 | $22,486 | $4,356 | $18,130 |
| 2017 | $7,142 | $22,486 | $4,356 | $18,130 |
| 2016 | $6,446 | $18,976 | $3,630 | $15,346 |
| 2015 | $6,302 | $18,976 | $3,630 | $15,346 |
| 2014 | $6,233 | $18,976 | $3,630 | $15,346 |
| 2013 | $6,758 | $22,336 | $3,630 | $18,706 |
Source: Public Records
Map
Nearby Homes
- 10109 S Cicero Ave Unit 206
- 9904 S Cicero Ave
- 4433 W 100th St
- 9821 S Cicero Ave Unit 8
- 9909 Elm Circle Dr
- 10008 S Kolin Ave
- 10036 S Kolin Ave
- 4325 W 99th Place
- 4320 W 99th Place
- 10336 S Keating Ave Unit 102
- 10403 S Keating Ave Unit 1C
- 10036 S Tripp Ave
- 4228 W 100th St
- 10155 S Kildare Ave
- 9520 S Kenton Ave
- 9617 Brandt Ave
- 10010 Harnew Rd W Unit 1
- 9526 S Kilbourn Ave
- 10016 Harnew Rd W
- 9510 S Kolmar Ave Unit 406
- 4625 W 100th St
- 4633 W 100th St
- 4621 W 100th St
- 4637 W 100th St
- 4632 W 100th Place
- 4628 W 100th Place
- 4636 W 100th Place
- 4624 W 100th Place
- 4641 W 100th St
- 4617 W 100th St
- 4620 W 100th Place
- 4628 W 100th St
- 4624 W 100th St
- 4632 W 100th St
- 10028 Kilpatrick Ave
- 4645 W 100th St
- 4613 W 100th St
- 4620 W 100th St
- 4636 W 100th St
- 4616 W 100th Place