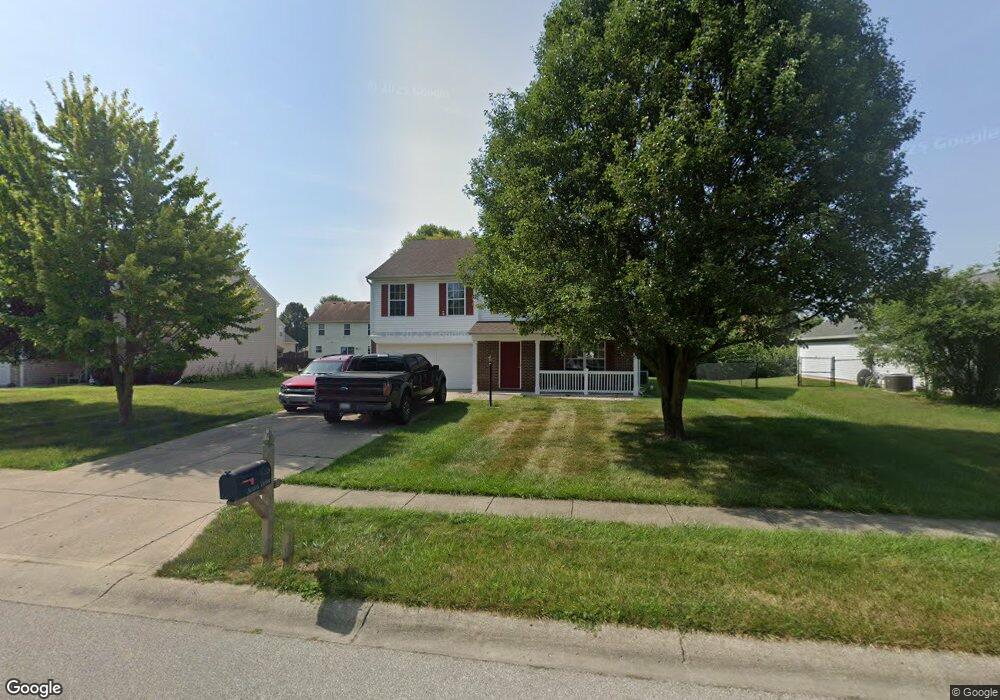
463 Acorn Dr Whiteland, IN 46184
Estimated Value: $339,000 - $354,000
4
Beds
3
Baths
2,698
Sq Ft
$128/Sq Ft
Est. Value
About This Home
This home is located at 463 Acorn Dr, Whiteland, IN 46184 and is currently estimated at $345,894, approximately $128 per square foot. 463 Acorn Dr is a home located in Johnson County with nearby schools including Whiteland Elementary School, Clark-Pleasant Middle School, and Whiteland Community High School.
Ownership History
Date
Name
Owned For
Owner Type
Purchase Details
Closed on
Jun 20, 2008
Sold by
Butcher James F
Bought by
Boland Randy
Current Estimated Value
Home Financials for this Owner
Home Financials are based on the most recent Mortgage that was taken out on this home.
Original Mortgage
$154,574
Interest Rate
5.96%
Create a Home Valuation Report for This Property
The Home Valuation Report is an in-depth analysis detailing your home's value as well as a comparison with similar homes in the area
Home Values in the Area
Average Home Value in this Area
Purchase History
| Date | Buyer | Sale Price | Title Company |
|---|---|---|---|
| Boland Randy | -- | Chicago Title Insurance Co |
Source: Public Records
Mortgage History
| Date | Status | Borrower | Loan Amount |
|---|---|---|---|
| Previous Owner | Boland Randy | $154,574 |
Source: Public Records
Tax History Compared to Growth
Tax History
| Year | Tax Paid | Tax Assessment Tax Assessment Total Assessment is a certain percentage of the fair market value that is determined by local assessors to be the total taxable value of land and additions on the property. | Land | Improvement |
|---|---|---|---|---|
| 2025 | $2,971 | $302,000 | $55,000 | $247,000 |
| 2024 | $2,971 | $284,000 | $55,000 | $229,000 |
| 2023 | $2,961 | $284,000 | $55,000 | $229,000 |
| 2022 | $2,690 | $258,500 | $43,300 | $215,200 |
| 2021 | $2,176 | $208,700 | $43,300 | $165,400 |
| 2020 | $1,940 | $185,200 | $43,300 | $141,900 |
| 2019 | $1,825 | $174,400 | $34,700 | $139,700 |
| 2018 | $1,804 | $181,700 | $20,100 | $161,600 |
| 2017 | $1,706 | $170,600 | $20,100 | $150,500 |
| 2016 | $1,576 | $153,500 | $20,100 | $133,400 |
| 2014 | $1,512 | $151,200 | $26,400 | $124,800 |
| 2013 | $1,512 | $140,000 | $26,400 | $113,600 |
Source: Public Records
Map
Nearby Homes