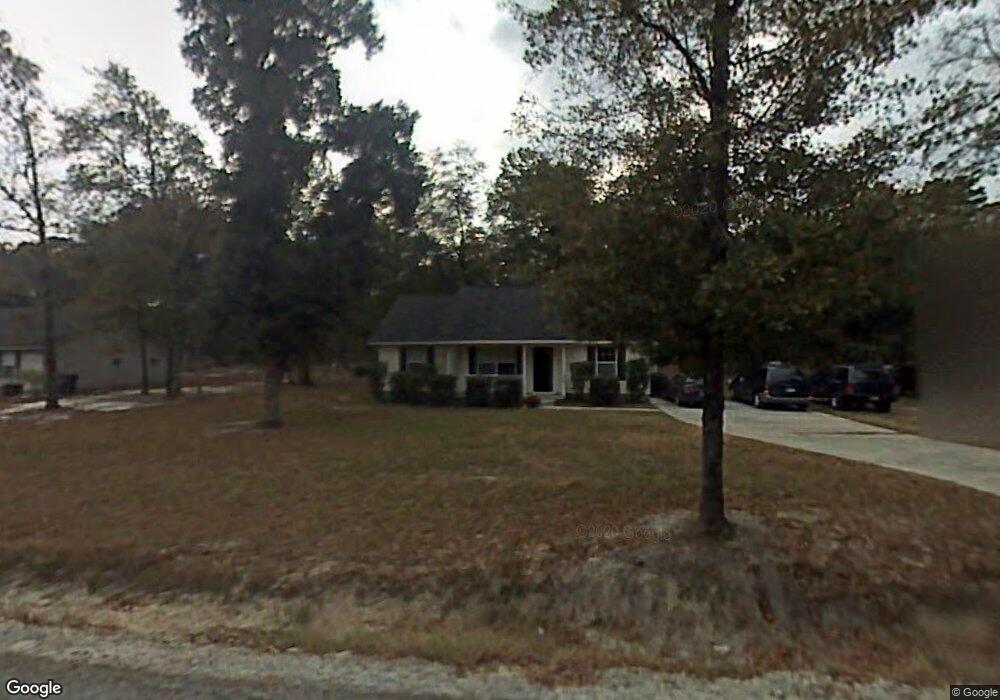
463 Archer Rd Guyton, GA 31312
Estimated Value: $234,000 - $290,000
--
Bed
1
Bath
1,134
Sq Ft
$230/Sq Ft
Est. Value
About This Home
This home is located at 463 Archer Rd, Guyton, GA 31312 and is currently estimated at $261,050, approximately $230 per square foot. 463 Archer Rd is a home located in Effingham County with nearby schools including Guyton Elementary School, Effingham County Middle School, and Effingham County High School.
Ownership History
Date
Name
Owned For
Owner Type
Purchase Details
Closed on
May 9, 2008
Sold by
Longo Gary R
Bought by
Couve Miriam R
Current Estimated Value
Home Financials for this Owner
Home Financials are based on the most recent Mortgage that was taken out on this home.
Original Mortgage
$115,684
Outstanding Balance
$73,109
Interest Rate
5.84%
Mortgage Type
New Conventional
Estimated Equity
$187,941
Purchase Details
Closed on
Oct 12, 2005
Sold by
Blanchett Jamie L
Bought by
Longo Gary R
Home Financials for this Owner
Home Financials are based on the most recent Mortgage that was taken out on this home.
Original Mortgage
$115,696
Interest Rate
5.71%
Mortgage Type
VA
Create a Home Valuation Report for This Property
The Home Valuation Report is an in-depth analysis detailing your home's value as well as a comparison with similar homes in the area
Home Values in the Area
Average Home Value in this Area
Purchase History
| Date | Buyer | Sale Price | Title Company |
|---|---|---|---|
| Couve Miriam R | $117,500 | -- | |
| Longo Gary R | $112,000 | -- |
Source: Public Records
Mortgage History
| Date | Status | Borrower | Loan Amount |
|---|---|---|---|
| Open | Couve Miriam R | $115,684 | |
| Previous Owner | Longo Gary R | $115,696 |
Source: Public Records
Tax History Compared to Growth
Tax History
| Year | Tax Paid | Tax Assessment Tax Assessment Total Assessment is a certain percentage of the fair market value that is determined by local assessors to be the total taxable value of land and additions on the property. | Land | Improvement |
|---|---|---|---|---|
| 2024 | $1,980 | $80,763 | $22,800 | $57,963 |
| 2023 | $1,193 | $61,958 | $17,600 | $44,358 |
| 2022 | $1,669 | $59,158 | $14,800 | $44,358 |
| 2021 | $1,620 | $52,234 | $14,000 | $38,234 |
| 2020 | $1,594 | $47,035 | $12,000 | $35,035 |
| 2019 | $1,541 | $45,035 | $10,000 | $35,035 |
| 2018 | $1,480 | $42,572 | $10,000 | $32,572 |
| 2017 | $1,487 | $42,572 | $10,000 | $32,572 |
| 2016 | $1,422 | $42,420 | $10,000 | $32,420 |
| 2015 | -- | $35,491 | $6,800 | $28,691 |
| 2014 | -- | $35,491 | $6,800 | $28,691 |
| 2013 | -- | $31,040 | $2,349 | $28,690 |
Source: Public Records
Map
Nearby Homes