463 Aron Ct Winnemucca, NV 89445
Estimated Value: $408,189 - $448,000
3
Beds
3
Baths
1,824
Sq Ft
$237/Sq Ft
Est. Value
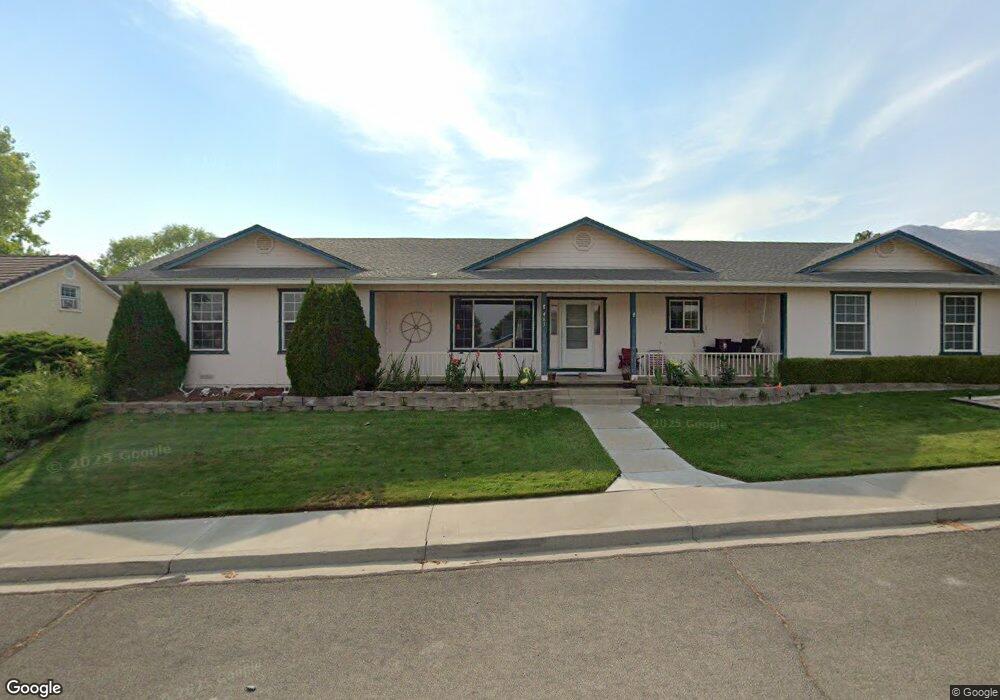
About This Home
This home is located at 463 Aron Ct, Winnemucca, NV 89445 and is currently estimated at $431,547, approximately $236 per square foot. 463 Aron Ct is a home located in Humboldt County with nearby schools including Winnemucca Grammar School, Winnemucca Junior High School, and French Ford Middle School.
Ownership History
Date
Name
Owned For
Owner Type
Purchase Details
Closed on
May 29, 2013
Sold by
Johnson Gary D and Johnson Nancy B
Bought by
Pearce Daniel S and Pearceh Samantha T
Current Estimated Value
Home Financials for this Owner
Home Financials are based on the most recent Mortgage that was taken out on this home.
Original Mortgage
$234,693
Outstanding Balance
$164,984
Interest Rate
3.38%
Mortgage Type
New Conventional
Estimated Equity
$266,563
Create a Home Valuation Report for This Property
The Home Valuation Report is an in-depth analysis detailing your home's value as well as a comparison with similar homes in the area
Purchase History
| Date | Buyer | Sale Price | Title Company |
|---|---|---|---|
| Pearce Daniel S | $230,000 | Western Title Company |
Source: Public Records
Mortgage History
| Date | Status | Borrower | Loan Amount |
|---|---|---|---|
| Open | Pearce Daniel S | $234,693 |
Source: Public Records
Tax History
| Year | Tax Paid | Tax Assessment Tax Assessment Total Assessment is a certain percentage of the fair market value that is determined by local assessors to be the total taxable value of land and additions on the property. | Land | Improvement |
|---|---|---|---|---|
| 2025 | $2,281 | $76,895 | $12,775 | $64,120 |
| 2024 | $2,217 | $77,650 | $12,775 | $64,874 |
| 2023 | $2,217 | $71,536 | $11,200 | $60,336 |
| 2022 | $2,096 | $62,692 | $11,200 | $51,492 |
| 2021 | $2,094 | $62,614 | $11,200 | $51,414 |
| 2020 | $2,134 | $63,879 | $11,200 | $52,679 |
| 2019 | $2,076 | $62,063 | $11,200 | $50,863 |
| 2018 | $2,046 | $61,118 | $11,200 | $49,918 |
| 2017 | $2,052 | $61,294 | $11,200 | $50,094 |
| 2016 | $2,093 | $63,216 | $11,200 | $52,016 |
| 2015 | $1,916 | $62,851 | $11,200 | $51,651 |
| 2014 | $1,916 | $59,762 | $9,100 | $50,662 |
Source: Public Records
Map
Nearby Homes
- 00 Summit Ave
- 250 W National Ave
- 15 Sunnyside Ave
- 210 Modoc Dr
- 20 Bellevue Ave
- 686 Castle Way
- 25 N Bridge St
- 290 Paradise Ave
- 8 Jungo Rd
- 05026612 Jungo Rd
- 05042402 Jungo Rd
- 77 Lay St
- 136 W 1st St
- 133 W 1st St
- 391 W 1st St
- 325 & 329 E Second St
- 15 Rd
- 15013611 Pavillion St
- 05-0331-33 Jungo Area
- Hwy 95 North U S Route 95
Your Personal Tour Guide
Ask me questions while you tour the home.