Estimated Value: $464,000 - $501,000
3
Beds
2
Baths
1,890
Sq Ft
$257/Sq Ft
Est. Value
About This Home
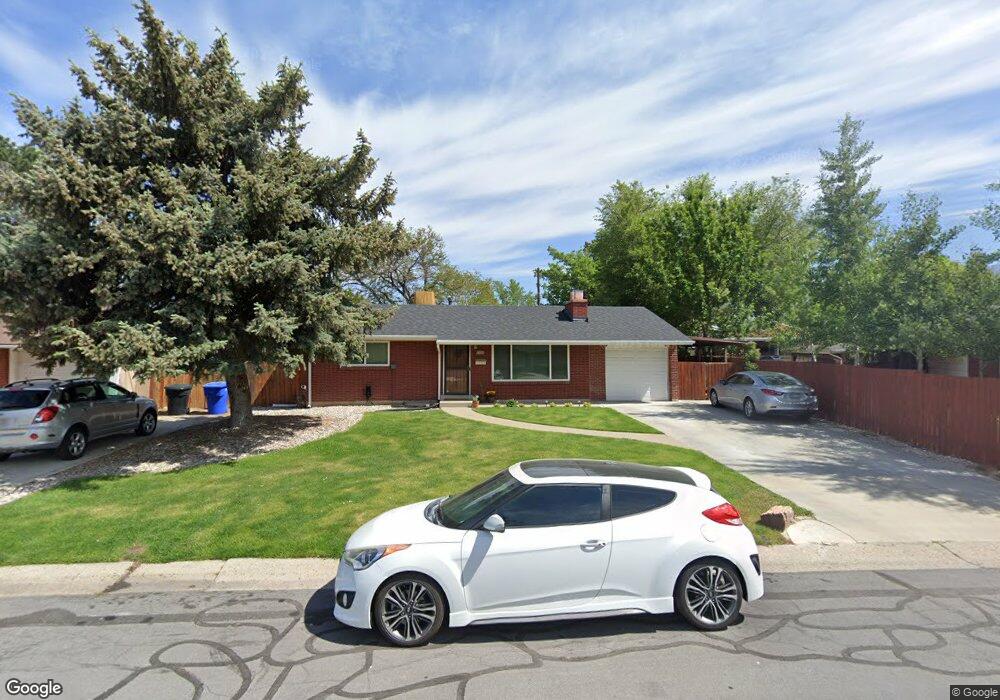
This home is located at 463 Bradley Way, Sandy, UT 84070 and is currently estimated at $485,901, approximately $257 per square foot. 463 Bradley Way is a home located in Salt Lake County with nearby schools including Midvalley Elementary School, Union Middle School, and Hillcrest High School.
Ownership History
Date
Name
Owned For
Owner Type
Purchase Details
Closed on
Mar 4, 2022
Sold by
Leroy Ika
Bought by
Ventura-Smith Kaneala and Ventura-Smith Callie
Current Estimated Value
Purchase Details
Closed on
Mar 3, 2022
Sold by
Leroy Ika
Bought by
Ventura-Smith Kaneala and Ventura-Smith Callie
Purchase Details
Closed on
Feb 14, 2005
Sold by
Ika Leroy
Bought by
Ika Leroy and Ika Mele
Home Financials for this Owner
Home Financials are based on the most recent Mortgage that was taken out on this home.
Original Mortgage
$24,000
Interest Rate
5.24%
Mortgage Type
Credit Line Revolving
Purchase Details
Closed on
Jan 21, 2000
Sold by
Carter Richard J
Bought by
Carter Maxine E
Purchase Details
Closed on
Jan 2, 2000
Sold by
Johnson Susan J
Bought by
Carter Maxine E
Purchase Details
Closed on
Dec 6, 1999
Sold by
Carter Richard J
Bought by
Carter Maxine E
Purchase Details
Closed on
Dec 3, 1999
Sold by
Johnson Susan J
Bought by
Carter Maxine E
Create a Home Valuation Report for This Property
The Home Valuation Report is an in-depth analysis detailing your home's value as well as a comparison with similar homes in the area
Home Values in the Area
Average Home Value in this Area
Purchase History
| Date | Buyer | Sale Price | Title Company |
|---|---|---|---|
| Ventura-Smith Kaneala | -- | First American Title | |
| Ventura-Smith Kaneala | -- | First American Title | |
| Ika Leroy | -- | -- | |
| Carter Maxine E | -- | Surety Title Agency | |
| Carter Maxine E | -- | Surety Title Agency | |
| Carter Maxine E | -- | Surety Title | |
| Carter Maxine E | -- | Surety Title Agency |
Source: Public Records
Mortgage History
| Date | Status | Borrower | Loan Amount |
|---|---|---|---|
| Previous Owner | Ika Leroy | $24,000 |
Source: Public Records
Tax History Compared to Growth
Tax History
| Year | Tax Paid | Tax Assessment Tax Assessment Total Assessment is a certain percentage of the fair market value that is determined by local assessors to be the total taxable value of land and additions on the property. | Land | Improvement |
|---|---|---|---|---|
| 2025 | $2,428 | $454,200 | $127,400 | $326,800 |
| 2024 | $2,428 | $448,500 | $119,700 | $328,800 |
| 2023 | $2,104 | $387,600 | $113,800 | $273,800 |
| 2022 | $2,326 | $399,100 | $111,600 | $287,500 |
| 2021 | $2,094 | $303,300 | $97,000 | $206,300 |
| 2020 | $1,892 | $273,200 | $78,600 | $194,600 |
| 2019 | $1,955 | $259,000 | $78,600 | $180,400 |
| 2018 | $1,644 | $230,600 | $78,600 | $152,000 |
| 2017 | $1,521 | $212,100 | $69,800 | $142,300 |
| 2016 | $1,855 | $205,500 | $69,800 | $135,700 |
| 2015 | $1,847 | $195,600 | $72,600 | $123,000 |
| 2014 | $1,821 | $187,700 | $70,500 | $117,200 |
Source: Public Records
Map
Nearby Homes
- 416 E 8260 S
- 8366 S Levine Ln
- 500 E 8120 S
- 8143 S 535 E
- 547 E Pioneer Ave
- 292 E Water Mill Way Unit 233
- 218 E Julie Anna Dr
- 8087 S 615 E
- 274 E Water Mill Way Unit 230
- 8072 S 300 E Unit 246
- 8550 S 570 E
- 8073 S Paper Mill Dr
- 283 E Pioneer Ave
- 257 Water Mill Way Unit 211
- 8544 S 300 E
- 772 E 8270 S
- 144 E Chambord Ct
- 140 E Chambord Ct
- 7944 Harvel Dr
- Sargent Plan at The Mill
- 453 Bradley Way
- 453 E Bradley Way
- 8292 S Romaine Dr
- 8292 Romaine Dr
- 8284 Romaine Dr
- 468 E 8260 S
- 458 E 8260 S
- 443 E Bradley Way
- 443 Bradley Way
- 466 E Bradley Way
- 466 Bradley Way
- 446 E 8260 S
- 454 E Bradley Way
- 454 Bradley Way
- 482 E 8260 S
- 433 Bradley Way
- 436 E 8260 S
- 444 E Bradley Way
- 8297 Romaine Dr
- 444 Bradley Way