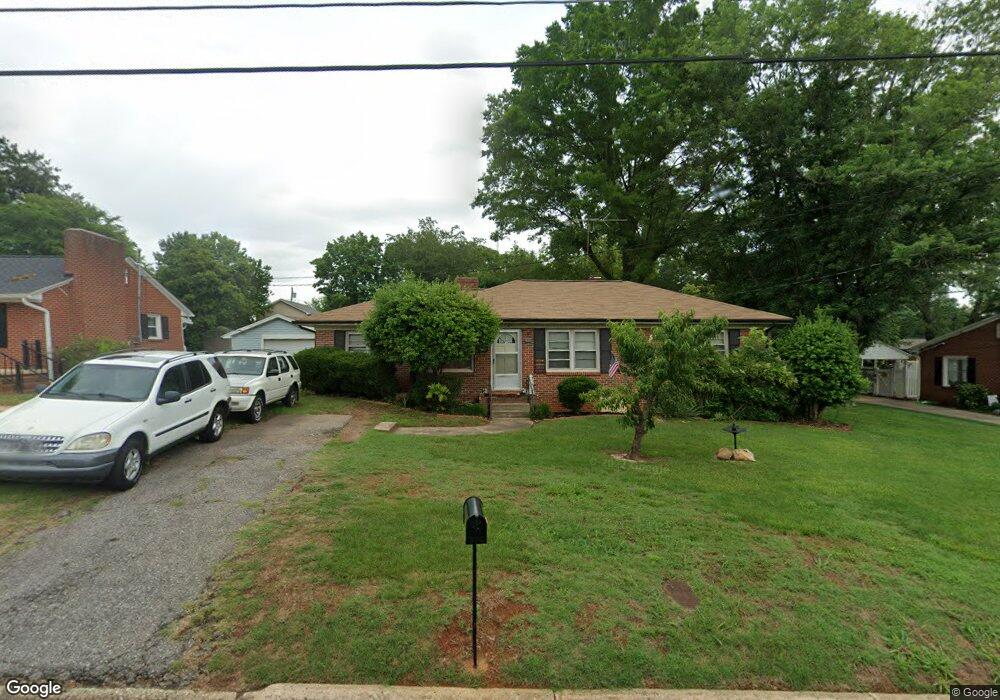
463 Hillcrest Dr Statesville, NC 28677
Estimated Value: $197,000 - $242,000
3
Beds
2
Baths
2,074
Sq Ft
$107/Sq Ft
Est. Value
About This Home
This home is located at 463 Hillcrest Dr, Statesville, NC 28677 and is currently estimated at $222,036, approximately $107 per square foot. 463 Hillcrest Dr is a home located in Iredell County with nearby schools including Cloverleaf Elementary School, Third Creek Middle School, and Statesville High School.
Ownership History
Date
Name
Owned For
Owner Type
Purchase Details
Closed on
Jul 18, 2022
Sold by
Jimenez Taborda and Jimenez Claudia
Bought by
Chiuz Carmen J and Paramo Jose William
Current Estimated Value
Home Financials for this Owner
Home Financials are based on the most recent Mortgage that was taken out on this home.
Original Mortgage
$145,500
Outstanding Balance
$138,593
Interest Rate
5.23%
Mortgage Type
New Conventional
Estimated Equity
$83,443
Purchase Details
Closed on
Apr 7, 2006
Sold by
Shelton Mary Aiken
Bought by
Taborda Didier and Taborda Doris Chiuz
Home Financials for this Owner
Home Financials are based on the most recent Mortgage that was taken out on this home.
Original Mortgage
$84,600
Interest Rate
6.29%
Mortgage Type
Fannie Mae Freddie Mac
Purchase Details
Closed on
Jun 1, 1957
Create a Home Valuation Report for This Property
The Home Valuation Report is an in-depth analysis detailing your home's value as well as a comparison with similar homes in the area
Home Values in the Area
Average Home Value in this Area
Purchase History
| Date | Buyer | Sale Price | Title Company |
|---|---|---|---|
| Chiuz Carmen J | $150,000 | Simon Peter W | |
| Taborda Didier | -- | Simon Peter W | |
| Taborda Didier | -- | Simon Peter W | |
| Taborda Didier | $94,000 | None Available | |
| -- | -- | -- |
Source: Public Records
Mortgage History
| Date | Status | Borrower | Loan Amount |
|---|---|---|---|
| Open | Taborda Didier | $145,500 | |
| Closed | Taborda Didier | $0 | |
| Previous Owner | Taborda Didier | $84,600 |
Source: Public Records
Tax History Compared to Growth
Tax History
| Year | Tax Paid | Tax Assessment Tax Assessment Total Assessment is a certain percentage of the fair market value that is determined by local assessors to be the total taxable value of land and additions on the property. | Land | Improvement |
|---|---|---|---|---|
| 2024 | $1,584 | $149,740 | $30,000 | $119,740 |
| 2023 | $1,584 | $149,740 | $30,000 | $119,740 |
| 2022 | $1,047 | $85,380 | $16,000 | $69,380 |
| 2021 | $1,103 | $85,380 | $16,000 | $69,380 |
| 2020 | $1,103 | $85,380 | $16,000 | $69,380 |
| 2019 | $1,094 | $85,380 | $16,000 | $69,380 |
| 2018 | $1,035 | $85,560 | $16,000 | $69,560 |
| 2017 | $1,017 | $85,560 | $16,000 | $69,560 |
| 2016 | $1,017 | $85,560 | $16,000 | $69,560 |
| 2015 | $854 | $85,560 | $16,000 | $69,560 |
| 2014 | $840 | $88,020 | $18,000 | $70,020 |
Source: Public Records
Map
Nearby Homes
- 535 N Carolina Ave
- 1540 Royalty Cir
- 915 Brookwood Ct
- 535 Gaither Rd
- 878 Henkel Rd
- 1345 Radio Rd
- 504 Holland Dr
- 712 N Center St
- 636 Hackett St
- 630 Hackett St
- 808 Henkel Rd
- 761 N Center St
- 920 Thomas St
- 724 N Kelly St
- 1061 the Glen
- 1109 Bunch Dr
- 809 N Mulberry St
- 600 N Mulberry St
- 301 Museum Rd
- 0000 Wilkesboro Hwy
- 467 Hillcrest Dr
- 457 Hillcrest Dr
- 472 Virginia Ave
- 464 Virginia Ave
- 451 Hillcrest Dr
- 1003 Radio Rd
- 1023 Radio Rd
- 462 Hillcrest Dr
- 456 Virginia Ave
- 941 Radio Rd
- 445 Hillcrest Dr
- 452 Hillcrest Dr
- 939 Radio Rd
- 481 Virginia Ave
- 448 Virginia Ave
- 465 Virginia Ave
- 1101 Radio Rd
- 439 Hillcrest Dr
- 444 Hillcrest Dr
- 457 Virginia Ave