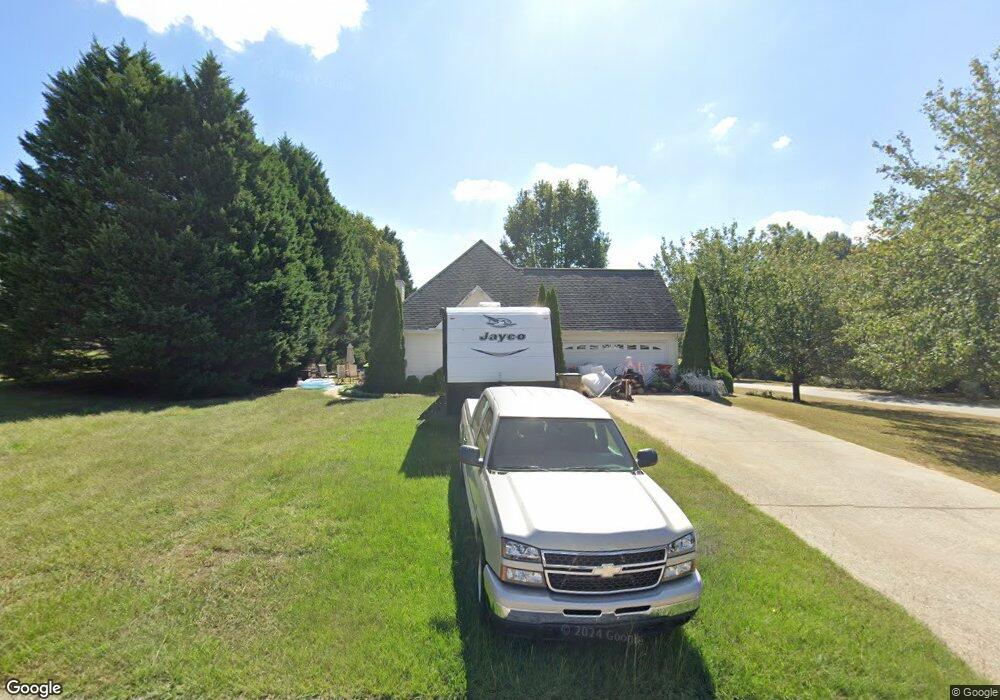
463 Lisa Cir Winder, GA 30680
Estimated Value: $340,107 - $353,000
3
Beds
2
Baths
1,862
Sq Ft
$186/Sq Ft
Est. Value
About This Home
This home is located at 463 Lisa Cir, Winder, GA 30680 and is currently estimated at $346,527, approximately $186 per square foot. 463 Lisa Cir is a home located in Barrow County with nearby schools including Bramlett Elementary School, Russell Middle School, and Winder-Barrow High School.
Ownership History
Date
Name
Owned For
Owner Type
Purchase Details
Closed on
Jun 24, 2008
Sold by
Us Bk Na
Bought by
Foster Josh and Foster Toni
Current Estimated Value
Home Financials for this Owner
Home Financials are based on the most recent Mortgage that was taken out on this home.
Original Mortgage
$113,106
Outstanding Balance
$72,245
Interest Rate
5.96%
Mortgage Type
FHA
Estimated Equity
$274,282
Purchase Details
Closed on
Apr 1, 2008
Sold by
Petterson Kimberly S
Bought by
Us Bk Na
Purchase Details
Closed on
Jan 11, 2005
Sold by
Petterson Judson K A
Bought by
Petterson Kimberly Sue
Purchase Details
Closed on
Sep 25, 1997
Sold by
Pace Prop
Bought by
Petterson Judson K and Petterson Kimberly S
Home Financials for this Owner
Home Financials are based on the most recent Mortgage that was taken out on this home.
Original Mortgage
$116,790
Interest Rate
7.6%
Mortgage Type
FHA
Purchase Details
Closed on
Dec 20, 1996
Sold by
C G S Development In
Bought by
Propertie David Pace
Purchase Details
Closed on
Oct 31, 1994
Bought by
C G S Development In
Create a Home Valuation Report for This Property
The Home Valuation Report is an in-depth analysis detailing your home's value as well as a comparison with similar homes in the area
Home Values in the Area
Average Home Value in this Area
Purchase History
| Date | Buyer | Sale Price | Title Company |
|---|---|---|---|
| Foster Josh | $114,000 | -- | |
| Us Bk Na | $106,800 | -- | |
| Us Bank National Association As Trustee | -- | -- | |
| Petterson Kimberly Sue | -- | -- | |
| Petterson Judson K | $114,500 | -- | |
| Propertie David Pace | -- | -- | |
| C G S Development In | -- | -- |
Source: Public Records
Mortgage History
| Date | Status | Borrower | Loan Amount |
|---|---|---|---|
| Open | Foster Josh | $113,106 | |
| Previous Owner | Petterson Judson K | $116,790 |
Source: Public Records
Tax History Compared to Growth
Tax History
| Year | Tax Paid | Tax Assessment Tax Assessment Total Assessment is a certain percentage of the fair market value that is determined by local assessors to be the total taxable value of land and additions on the property. | Land | Improvement |
|---|---|---|---|---|
| 2024 | $2,765 | $113,492 | $20,000 | $93,492 |
| 2023 | $2,355 | $113,892 | $20,000 | $93,892 |
| 2022 | $2,086 | $74,422 | $20,000 | $54,422 |
| 2021 | $1,721 | $58,417 | $16,000 | $42,417 |
| 2020 | $1,721 | $58,417 | $16,000 | $42,417 |
| 2019 | $1,750 | $58,417 | $16,000 | $42,417 |
| 2018 | $1,611 | $54,616 | $14,200 | $40,416 |
| 2017 | $1,414 | $48,581 | $14,200 | $34,381 |
| 2016 | $1,316 | $46,007 | $14,200 | $31,807 |
| 2015 | $1,344 | $46,764 | $14,200 | $32,564 |
| 2014 | $1,145 | $39,900 | $6,958 | $32,942 |
| 2013 | -- | $38,326 | $6,958 | $31,368 |
Source: Public Records
Map
Nearby Homes
- 443 Robins Way
- 65 Cardinal Pond Ln
- 65 Cardinal Pond Ln Unit 9A
- 62 Cardinal Pond Ln Unit 5A
- 14 Bramblewood Dr
- 38 Cardinal Pond Ln Unit 3A
- 119 Wingate Rd
- 40 Cardinal Ridge Ct Unit 40A
- 38 Cardinal Pond Ln
- 40 Cardinal Ridge Ct
- 14 Bramblewood Dr Unit 38A
- Noah Plan at Summerlin
- Cambridge Plan at Summerlin
- Kingston Plan at Summerlin
- Colburn Plan at Summerlin
- Winston Plan at Summerlin
- Canterbury Plan at Summerlin
- Stanford Plan at Summerlin
- Turnbridge Plan at Summerlin
- Brooke UHP Plan at Summerlin
- 463 Lisa Cir Unit 3
- 467 Lisa Cir
- 237 Nicholas St Unit 3
- 461 Lisa Cir
- 238 Nicholas St Unit 3
- 468 Lisa Cir
- 235 Nicholas St
- 471 Lisa Cir Unit 4
- 466 Lisa Cir
- 464 Lisa Cir Unit 3
- 470 Lisa Cir Unit 49
- 470 Lisa Cir
- 462 Lisa Cir Unit 3
- 233 Nicholas St
- 460 Lisa Cir Unit 49
- 460 Lisa Cir
- 472 Lisa Cir
- 483 Lisa Cir
- 232 Nicholas St Unit 3
- 455 Lisa Cir