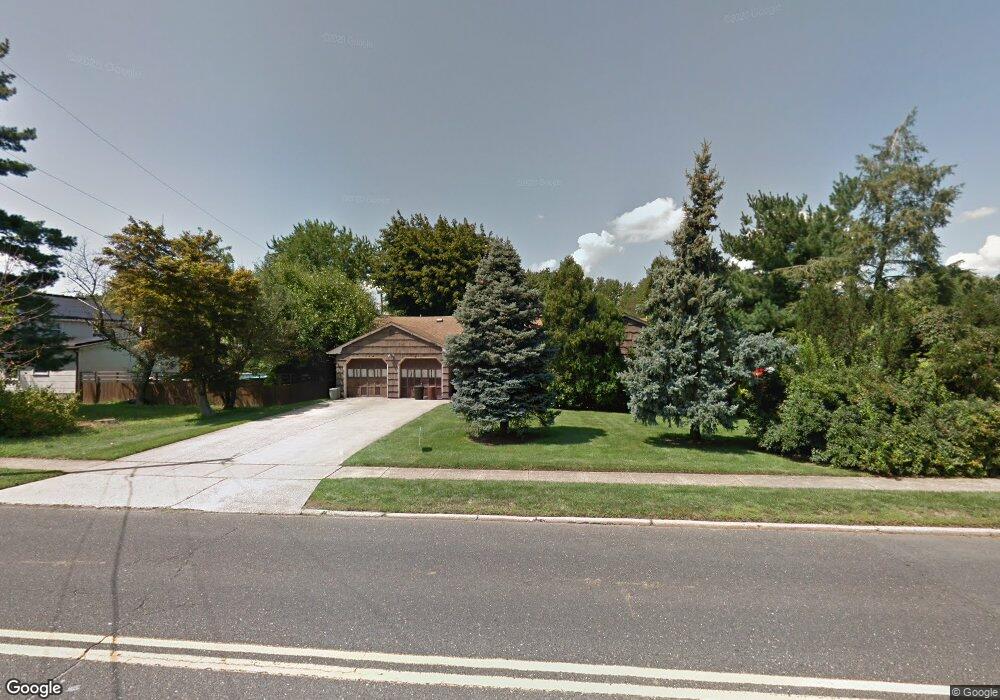
463 Lloyd Rd Matawan, NJ 07747
Estimated Value: $698,021
3
Beds
2
Baths
1,762
Sq Ft
$396/Sq Ft
Est. Value
About This Home
This home is located at 463 Lloyd Rd, Matawan, NJ 07747 and is currently priced at $698,021, approximately $396 per square foot. 463 Lloyd Rd is a home located in Monmouth County with nearby schools including Matawan Reg High School, St Benedict School, and St. Joseph Elementary School.
Ownership History
Date
Name
Owned For
Owner Type
Purchase Details
Closed on
May 20, 2022
Sold by
Grivas Georgette A
Bought by
Grivas Gus
Current Estimated Value
Purchase Details
Closed on
Feb 21, 2020
Sold by
Grivas George M
Bought by
Grivas Georgette A
Purchase Details
Closed on
Nov 18, 2011
Sold by
Grivas George and Grivas Gus
Bought by
Grivas George
Create a Home Valuation Report for This Property
The Home Valuation Report is an in-depth analysis detailing your home's value as well as a comparison with similar homes in the area
Home Values in the Area
Average Home Value in this Area
Purchase History
| Date | Buyer | Sale Price | Title Company |
|---|---|---|---|
| Grivas Gus | -- | Cretella George | |
| Grivas Gus | -- | Cretella George | |
| Grivas Georgette A | -- | None Available | |
| Grivas George | -- | Fidelity Natl Title Ins Co |
Source: Public Records
Tax History
| Year | Tax Paid | Tax Assessment Tax Assessment Total Assessment is a certain percentage of the fair market value that is determined by local assessors to be the total taxable value of land and additions on the property. | Land | Improvement |
|---|---|---|---|---|
| 2025 | $10,194 | $569,300 | $396,400 | $172,900 |
| 2024 | $9,773 | $504,400 | $334,700 | $169,700 |
| 2023 | $9,773 | $456,900 | $291,100 | $165,800 |
| 2022 | $8,605 | $385,400 | $227,600 | $157,800 |
| 2021 | $8,605 | $346,600 | $206,200 | $140,400 |
| 2020 | $9,564 | $352,400 | $215,200 | $137,200 |
| 2019 | $9,472 | $339,000 | $202,600 | $136,400 |
| 2018 | $9,058 | $325,000 | $194,900 | $130,100 |
| 2017 | $8,326 | $303,000 | $176,900 | $126,100 |
| 2016 | $7,752 | $294,400 | $171,500 | $122,900 |
| 2015 | $8,231 | $309,200 | $177,800 | $131,400 |
| 2014 | $7,825 | $300,200 | $169,700 | $130,500 |
Source: Public Records
Map
Nearby Homes
- 110 Courtland Ln
- 537 S Atlantic Ave
- 5 Limerick Place
- 11 Anton Place
- 20 Galway Dr
- 16 Galway Dr
- 3 Noble Place
- 33 Balmoral Ct Unit 33
- 114 Dundee Ct
- 99 Idlebrook Ln
- 72 Idlebrook Ln
- 244 Lloyd Rd
- 9 Amherst Ct
- 182 Edinburgh Ct
- 49 Lucia Ct
- 101 Broad St
- 13 Cresci Blvd
- 323 Arlene Terrace
- 315 Wellington Place
- 414 Sloan Ct
Your Personal Tour Guide
Ask me questions while you tour the home.