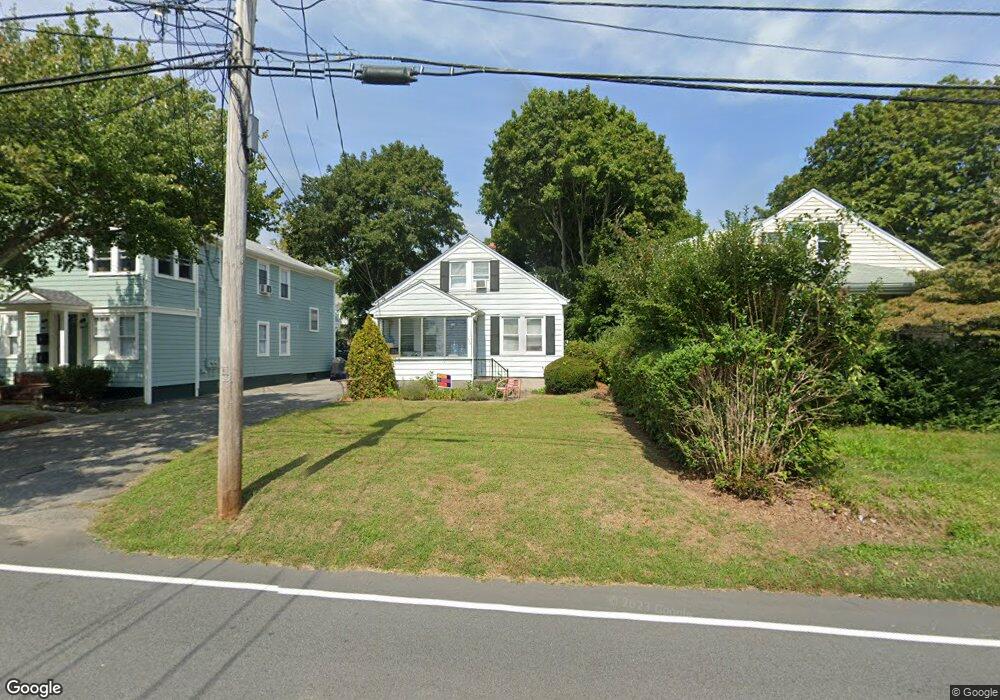
463 Maple Ave Barrington, RI 02806
North Barrington NeighborhoodEstimated Value: $380,000 - $659,000
3
Beds
1
Bath
960
Sq Ft
$511/Sq Ft
Est. Value
About This Home
This home is located at 463 Maple Ave, Barrington, RI 02806 and is currently estimated at $490,579, approximately $511 per square foot. 463 Maple Ave is a home located in Bristol County with nearby schools including Barrington High School, St Luke Elementary School, and Barrington Christian Academy.
Ownership History
Date
Name
Owned For
Owner Type
Purchase Details
Closed on
Mar 4, 2024
Sold by
Monti Deann J and Monti Steven M
Bought by
Monti Properties Llc
Current Estimated Value
Purchase Details
Closed on
Dec 6, 1995
Sold by
Jiacovelli Albert W
Bought by
Monti Steven M and Monti Deann
Home Financials for this Owner
Home Financials are based on the most recent Mortgage that was taken out on this home.
Original Mortgage
$67,450
Interest Rate
7.44%
Mortgage Type
Purchase Money Mortgage
Create a Home Valuation Report for This Property
The Home Valuation Report is an in-depth analysis detailing your home's value as well as a comparison with similar homes in the area
Home Values in the Area
Average Home Value in this Area
Purchase History
| Date | Buyer | Sale Price | Title Company |
|---|---|---|---|
| Monti Properties Llc | -- | None Available | |
| Monti Steven M | $45,000 | -- | |
| Monti Steven M | $45,000 | -- |
Source: Public Records
Mortgage History
| Date | Status | Borrower | Loan Amount |
|---|---|---|---|
| Previous Owner | Monti Steven M | $112,000 | |
| Previous Owner | Monti Steven M | $67,450 |
Source: Public Records
Tax History
| Year | Tax Paid | Tax Assessment Tax Assessment Total Assessment is a certain percentage of the fair market value that is determined by local assessors to be the total taxable value of land and additions on the property. | Land | Improvement |
|---|---|---|---|---|
| 2025 | $5,753 | $375,000 | $204,000 | $171,000 |
| 2024 | $5,531 | $375,000 | $204,000 | $171,000 |
| 2023 | $5,055 | $249,000 | $117,000 | $132,000 |
| 2022 | $4,893 | $249,000 | $117,000 | $132,000 |
| 2021 | $4,768 | $249,000 | $117,000 | $132,000 |
| 2020 | $4,556 | $218,000 | $96,000 | $122,000 |
| 2019 | $4,382 | $218,000 | $96,000 | $122,000 |
| 2018 | $4,251 | $218,000 | $96,000 | $122,000 |
| 2017 | $3,876 | $193,800 | $91,100 | $102,700 |
| 2016 | $3,576 | $193,800 | $91,100 | $102,700 |
| 2015 | $3,537 | $193,800 | $91,100 | $102,700 |
| 2014 | $3,748 | $204,800 | $91,100 | $113,700 |
Source: Public Records
Map
Nearby Homes
- 53 Whipple Ave
- 381 Maple Ave
- 603 Maple Ave
- 26 Tiffany Cir
- 154 Lincoln Ave
- 351 County Rd
- 29 N Lake Dr
- 6 Conway Dr
- 20 Townsend St
- 150 Alfred Drowne Rd
- 11 Elton Rd
- 168 Washington Rd
- 71 Alfred Drown Rd
- 1 Massasoit Ave
- 11 Mathewson Rd
- 51 Hawthorne Ave
- 45 Washington Rd
- 22 Lantern Ln
- 1741 Wampanoag Trail
- 9 Lillis Ave
Your Personal Tour Guide
Ask me questions while you tour the home.