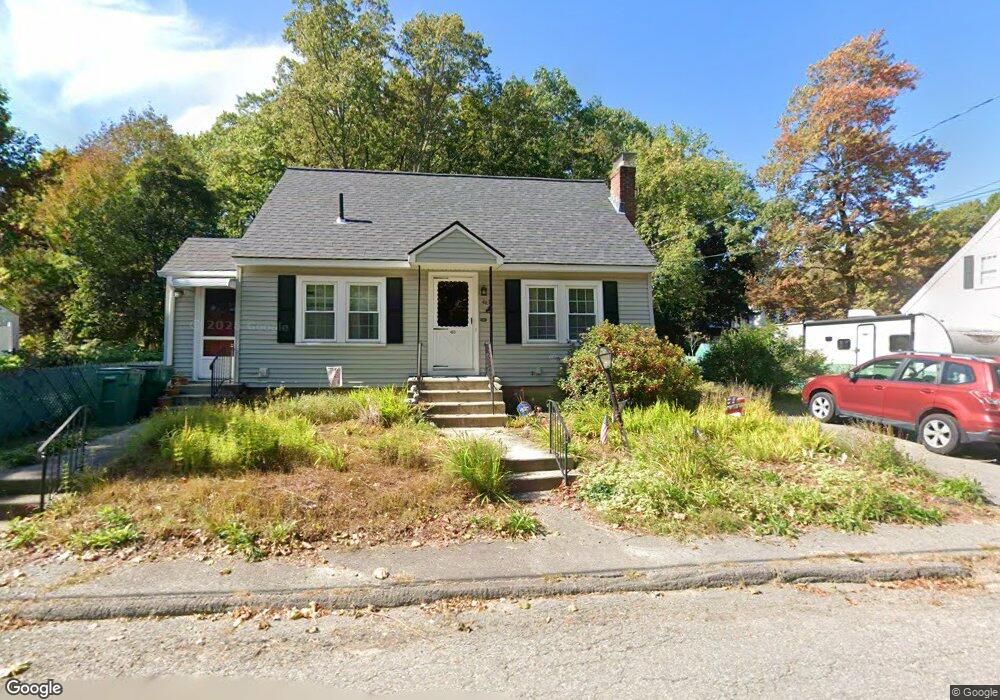
463 Milk St Fitchburg, MA 01420
Southside NeighborhoodEstimated Value: $335,000 - $380,000
3
Beds
1
Bath
1,108
Sq Ft
$323/Sq Ft
Est. Value
About This Home
This home is located at 463 Milk St, Fitchburg, MA 01420 and is currently estimated at $358,227, approximately $323 per square foot. 463 Milk St is a home located in Worcester County with nearby schools including South Street Elementary School, Reingold Elementary School, and Crocker Elementary School.
Ownership History
Date
Name
Owned For
Owner Type
Purchase Details
Closed on
Mar 24, 1995
Sold by
Langley Svea L
Bought by
Goguen Kathleen M
Current Estimated Value
Home Financials for this Owner
Home Financials are based on the most recent Mortgage that was taken out on this home.
Original Mortgage
$48,650
Interest Rate
8.78%
Mortgage Type
Purchase Money Mortgage
Create a Home Valuation Report for This Property
The Home Valuation Report is an in-depth analysis detailing your home's value as well as a comparison with similar homes in the area
Home Values in the Area
Average Home Value in this Area
Purchase History
| Date | Buyer | Sale Price | Title Company |
|---|---|---|---|
| Goguen Kathleen M | $64,900 | -- |
Source: Public Records
Mortgage History
| Date | Status | Borrower | Loan Amount |
|---|---|---|---|
| Open | Goguen Kathleen M | $20,000 | |
| Open | Goguen Kathleen M | $54,500 | |
| Closed | Goguen Kathleen M | $20,000 | |
| Closed | Goguen Kathleen M | $48,650 | |
| Closed | Goguen Kathleen M | $12,950 |
Source: Public Records
Tax History Compared to Growth
Tax History
| Year | Tax Paid | Tax Assessment Tax Assessment Total Assessment is a certain percentage of the fair market value that is determined by local assessors to be the total taxable value of land and additions on the property. | Land | Improvement |
|---|---|---|---|---|
| 2025 | $41 | $306,000 | $103,700 | $202,300 |
| 2024 | $3,916 | $264,400 | $68,700 | $195,700 |
| 2023 | $3,773 | $235,500 | $60,100 | $175,400 |
| 2022 | $3,374 | $191,600 | $51,500 | $140,100 |
| 2021 | $3,345 | $175,800 | $41,700 | $134,100 |
| 2020 | $3,274 | $166,100 | $39,200 | $126,900 |
| 2019 | $3,147 | $153,600 | $52,700 | $100,900 |
| 2018 | $2,946 | $140,200 | $50,300 | $89,900 |
| 2017 | $2,755 | $128,200 | $50,300 | $77,900 |
| 2016 | $2,635 | $124,100 | $45,400 | $78,700 |
| 2015 | $2,587 | $125,100 | $46,600 | $78,500 |
| 2014 | $2,481 | $125,100 | $46,600 | $78,500 |
Source: Public Records
Map
Nearby Homes
- 559 Milk St
- 27 Clifton St
- 32 Clifton St
- 21 Burnap St
- 37 Putnam Park
- 50 Putnam Park
- 484 Rollstone St
- 7 Burnap St
- 48 Woodworth Ave
- 116 Pine St
- 53-55 Marion St
- 196 Hazel St
- 505 Old St S
- 535 South St Unit 14-2A
- 535 South St Unit 4-2A
- 535 South St Unit 7-2A
- 16 Thomas St
- 132 Hazel St
- 43 Saint Anthony St
- 0 Franklin Rd-Lots1-7 Unit 72947330