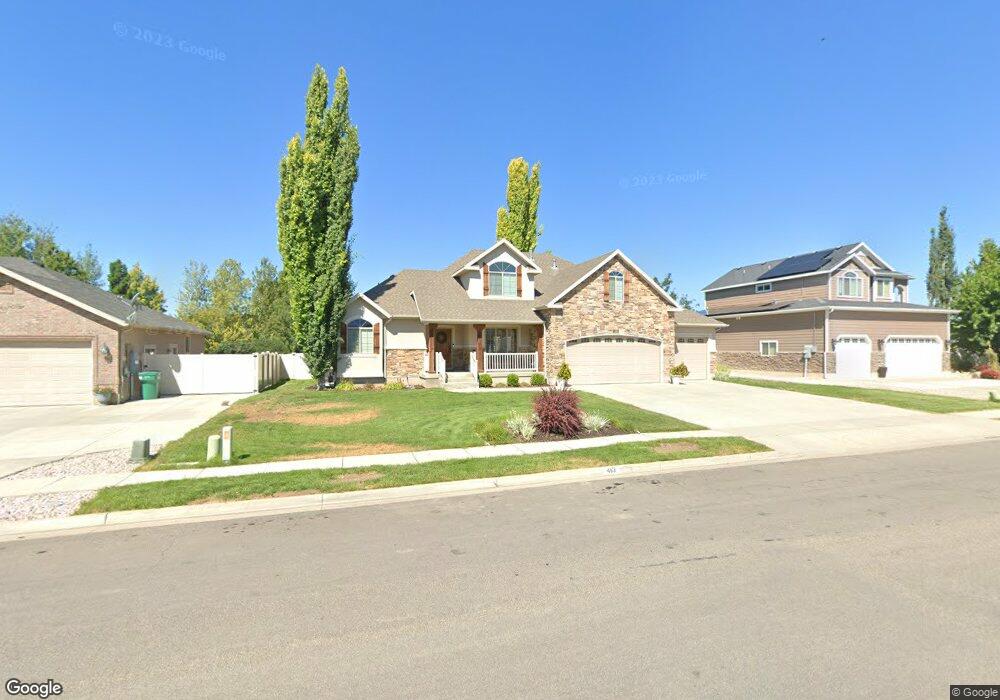
463 N 3475 W Layton, UT 84041
Estimated Value: $731,000 - $767,000
4
Beds
2
Baths
4,283
Sq Ft
$176/Sq Ft
Est. Value
About This Home
This home is located at 463 N 3475 W, Layton, UT 84041 and is currently estimated at $753,010, approximately $175 per square foot. 463 N 3475 W is a home located in Davis County with nearby schools including Sand Springs Elementary School, Legacy Junior High School, and Layton High School.
Ownership History
Date
Name
Owned For
Owner Type
Purchase Details
Closed on
Aug 1, 2016
Sold by
Porter Jeffrey and Porter Marceen
Bought by
Porter Marceen M and Porter Jeffrey L
Current Estimated Value
Purchase Details
Closed on
Feb 27, 2008
Sold by
Benchmark Real Estate Co
Bought by
Porter Jeffrey and Porter Marceen
Home Financials for this Owner
Home Financials are based on the most recent Mortgage that was taken out on this home.
Original Mortgage
$80,000
Outstanding Balance
$36,150
Interest Rate
5.64%
Mortgage Type
Credit Line Revolving
Estimated Equity
$716,860
Purchase Details
Closed on
Nov 17, 2005
Sold by
Mountain Green Development Llc
Bought by
Benchmark Real Estate Co
Create a Home Valuation Report for This Property
The Home Valuation Report is an in-depth analysis detailing your home's value as well as a comparison with similar homes in the area
Home Values in the Area
Average Home Value in this Area
Purchase History
We collect this data history from publicly available records. To have your information removed, we recommend requesting removal directly through your county’s website.
| Date | Buyer | Sale Price | Title Company |
|---|---|---|---|
| Porter Marceen M | -- | Hickman Land Title | |
| Porter Jeffrey | -- | Founders Title Co Layton | |
| Benchmark Real Estate Co | -- | Bonneville Title Company |
Source: Public Records
Mortgage History
We collect this data history from publicly available records. To have your information removed, we recommend requesting removal directly through your county’s website.
| Date | Status | Borrower | Loan Amount |
|---|---|---|---|
| Open | Porter Jeffrey | $80,000 | |
| Open | Porter Jeffrey | $320,000 |
Source: Public Records
Tax History
| Year | Tax Paid | Tax Assessment Tax Assessment Total Assessment is a certain percentage of the fair market value that is determined by local assessors to be the total taxable value of land and additions on the property. | Land | Improvement |
|---|---|---|---|---|
| 2025 | $3,736 | $392,150 | $130,666 | $261,484 |
| 2024 | $3,558 | $376,200 | $140,162 | $236,038 |
| 2023 | $3,477 | $648,000 | $147,594 | $500,406 |
| 2022 | $3,684 | $372,901 | $86,312 | $286,589 |
| 2021 | $3,392 | $512,000 | $129,451 | $382,549 |
| 2020 | $3,087 | $447,000 | $110,490 | $336,510 |
| 2019 | $3,003 | $426,000 | $109,514 | $316,486 |
| 2018 | $2,802 | $399,000 | $96,474 | $302,526 |
| 2016 | $2,615 | $192,115 | $39,883 | $152,232 |
| 2015 | $2,507 | $174,845 | $39,883 | $134,962 |
| 2014 | $2,215 | $157,903 | $39,883 | $118,020 |
| 2013 | -- | $187,552 | $40,379 | $147,173 |
Source: Public Records
Map
Nearby Homes
- 242 N 3600 W
- 3643 W 775 N
- 3246 W 850 N Unit 114
- 3266 W 850 N Unit 115
- 15 N 3300 W
- 34 S 3600 W
- 90 S Freedom Farms Dr
- 70 S Freedom Farms Dr
- 78 S Freedom Farms Dr
- 1097 N 3450 W
- 90 N 2975 W
- 967 W Yamada Ct
- 1108 N 3450 W
- 3288 W 1125 N
- 3535 W Overlook Dr
- 142 E 2675 S
- 78 E 2550 S
- 2480 S Main St
- 921 W 2700 S
- 2794 W Gentile St
- 449 N 3475 W
- 448 N 3475 W
- 431 N 3475 W
- 481 N 3475 W Unit 24
- 481 N 3475 W
- 460 N 3475 W
- 432 N 3475 W
- 464 N 3550 W
- 482 N 3475 W
- 3502 W 400 N Unit 20
- 3502 W 400 N
- 416 N 3475 W
- 436 N 3550 W
- 436 N 3550 W Unit 18
- 469 N 3425 W
- 447 N 3425 W
- 418 N 3550 W
- 471 N 3550 W
- 3489 W 550 N Unit 105
- 3509 W 550 N Unit 104
Your Personal Tour Guide
Ask me questions while you tour the home.