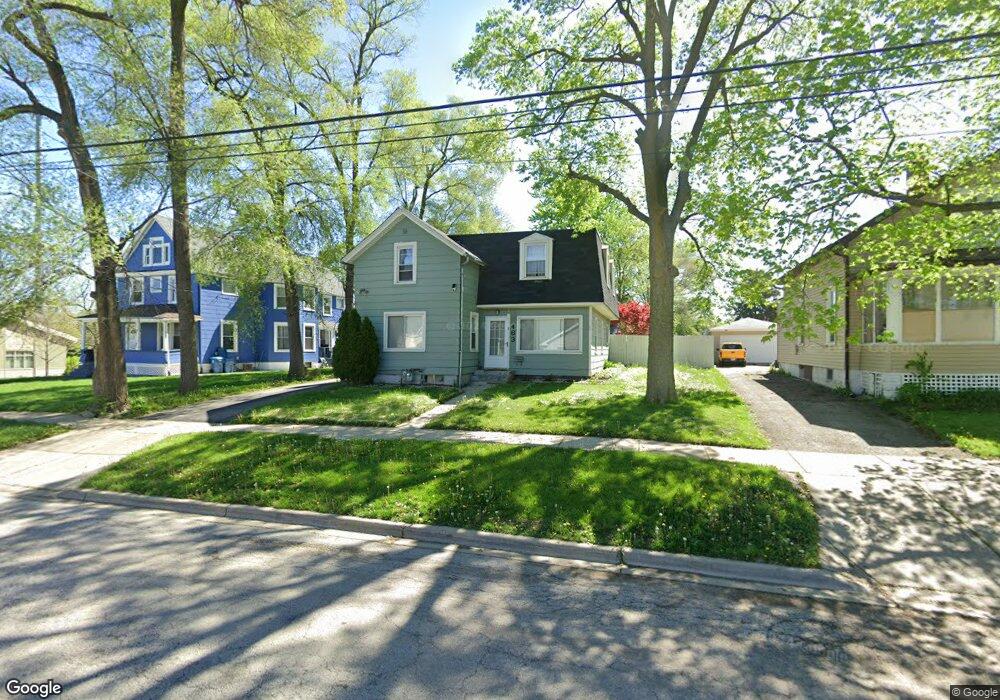
463 N Union St Aurora, IL 60505
McCarty Burlington NeighborhoodEstimated Value: $253,000 - $300,000
3
Beds
2
Baths
1,932
Sq Ft
$138/Sq Ft
Est. Value
About This Home
This home is located at 463 N Union St, Aurora, IL 60505 and is currently estimated at $266,810, approximately $138 per square foot. 463 N Union St is a home located in Kane County with nearby schools including Oak Park Elementary School, Simmons Middle School, and East Aurora High School.
Ownership History
Date
Name
Owned For
Owner Type
Purchase Details
Closed on
Nov 29, 2017
Sold by
Shupe Dale W
Bought by
Sotelo Jose Dejesus
Current Estimated Value
Home Financials for this Owner
Home Financials are based on the most recent Mortgage that was taken out on this home.
Original Mortgage
$162,011
Outstanding Balance
$137,477
Interest Rate
4.25%
Mortgage Type
FHA
Estimated Equity
$129,333
Purchase Details
Closed on
Nov 11, 2015
Sold by
Shupe Dale W and Shupe Aileen F
Bought by
Shupe Dale W
Purchase Details
Closed on
Apr 12, 2012
Sold by
Shupe Dale
Bought by
Shupe Dale W and Shupe Aileen F
Create a Home Valuation Report for This Property
The Home Valuation Report is an in-depth analysis detailing your home's value as well as a comparison with similar homes in the area
Home Values in the Area
Average Home Value in this Area
Purchase History
| Date | Buyer | Sale Price | Title Company |
|---|---|---|---|
| Sotelo Jose Dejesus | $165,000 | First American Title | |
| Shupe Dale W | -- | Accommodation | |
| Shupe Dale W | -- | None Available |
Source: Public Records
Mortgage History
| Date | Status | Borrower | Loan Amount |
|---|---|---|---|
| Open | Sotelo Jose Dejesus | $162,011 |
Source: Public Records
Tax History
| Year | Tax Paid | Tax Assessment Tax Assessment Total Assessment is a certain percentage of the fair market value that is determined by local assessors to be the total taxable value of land and additions on the property. | Land | Improvement |
|---|---|---|---|---|
| 2024 | $3,937 | $65,431 | $7,556 | $57,875 |
| 2023 | $3,771 | $58,462 | $6,751 | $51,711 |
| 2022 | $3,597 | $53,342 | $6,160 | $47,182 |
| 2021 | $3,525 | $49,662 | $5,735 | $43,927 |
| 2020 | $3,337 | $46,129 | $5,327 | $40,802 |
| 2019 | $3,318 | $43,655 | $4,936 | $38,719 |
| 2018 | $2,917 | $38,037 | $4,566 | $33,471 |
| 2017 | $2,783 | $34,382 | $4,207 | $30,175 |
| 2016 | $2,548 | $30,214 | $3,606 | $26,608 |
| 2015 | -- | $26,916 | $3,101 | $23,815 |
| 2014 | -- | $25,755 | $2,850 | $22,905 |
| 2013 | -- | $27,325 | $2,723 | $24,602 |
Source: Public Records
Map
Nearby Homes
Your Personal Tour Guide
Ask me questions while you tour the home.