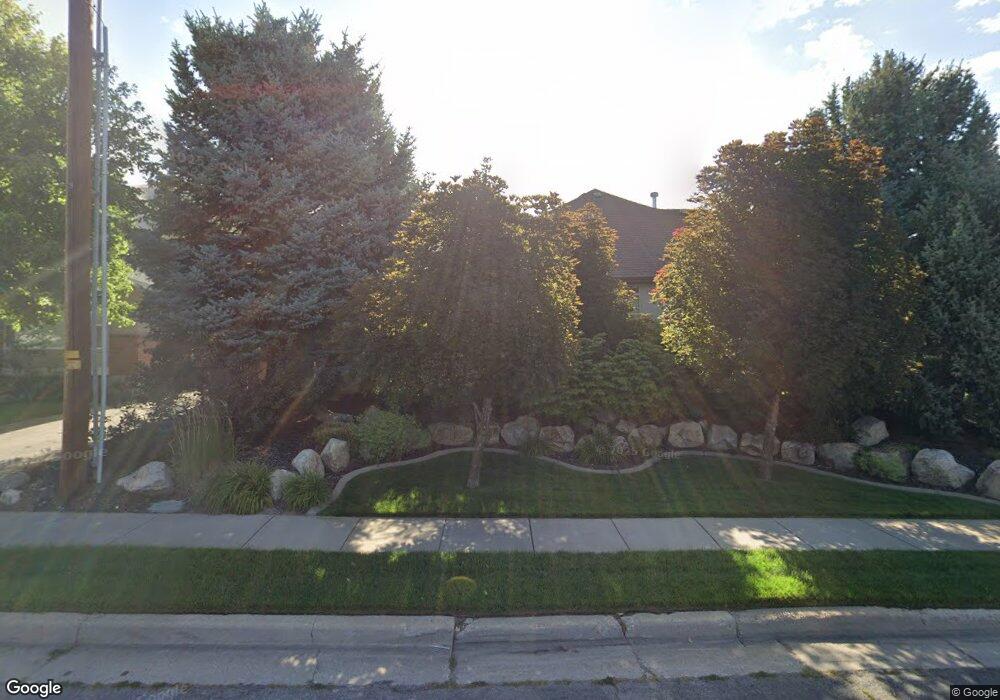
463 S 400 E Centerville, UT 84014
Estimated Value: $499,000 - $594,000
4
Beds
2
Baths
1,377
Sq Ft
$397/Sq Ft
Est. Value
About This Home
This home is located at 463 S 400 E, Centerville, UT 84014 and is currently estimated at $546,237, approximately $396 per square foot. 463 S 400 E is a home located in Davis County with nearby schools including J A Taylor Elementary School, Centerville Jr High, and Viewmont High School.
Ownership History
Date
Name
Owned For
Owner Type
Purchase Details
Closed on
Apr 7, 2025
Sold by
Avenir Enterprises Lp
Bought by
Avenir Legacy Llc
Current Estimated Value
Purchase Details
Closed on
Aug 18, 2017
Sold by
Trump Shane L and Trump Elizabethe Jeanne
Bought by
Avenir Enterprises Lp
Purchase Details
Closed on
Jun 29, 2000
Sold by
Erickson Jon T and Erickson Kerri L
Bought by
Trump Shane L and Trump Elizabeth Jeanne
Create a Home Valuation Report for This Property
The Home Valuation Report is an in-depth analysis detailing your home's value as well as a comparison with similar homes in the area
Purchase History
| Date | Buyer | Sale Price | Title Company |
|---|---|---|---|
| Avenir Legacy Llc | -- | None Listed On Document | |
| Avenir Legacy Llc | -- | None Listed On Document | |
| Avenir Enterprises Lp | -- | None Available | |
| Trump Shane L | -- | Security Title Company |
Source: Public Records
Tax History
| Year | Tax Paid | Tax Assessment Tax Assessment Total Assessment is a certain percentage of the fair market value that is determined by local assessors to be the total taxable value of land and additions on the property. | Land | Improvement |
|---|---|---|---|---|
| 2025 | $2,840 | $271,700 | $158,148 | $113,552 |
| 2024 | $2,685 | $261,249 | $140,930 | $120,319 |
| 2023 | $2,526 | $244,200 | $128,021 | $116,178 |
| 2022 | $2,659 | $468,000 | $213,106 | $254,894 |
| 2021 | $2,348 | $354,000 | $177,027 | $176,973 |
| 2020 | $2,070 | $312,000 | $173,875 | $138,125 |
| 2019 | $2,106 | $310,000 | $177,611 | $132,389 |
| 2018 | $1,952 | $284,000 | $164,993 | $119,007 |
| 2016 | $1,607 | $129,910 | $53,444 | $76,466 |
| 2015 | $1,525 | $116,270 | $53,444 | $62,826 |
| 2014 | $1,710 | $133,455 | $53,444 | $80,011 |
| 2013 | -- | $120,264 | $38,028 | $82,236 |
Source: Public Records
Map
Nearby Homes
- 495 E 475 S
- 328 E 1100 S
- 610 S 800 E
- 360 E Center St
- 150 E 735 S Unit 23
- 16 S 200 E
- 610 E Pages Ln
- 967 S Courtyard Ln
- 16 W 780 S
- 252 N 400 E
- 88 W 50 S Unit C-3
- 88 W 50 S Unit B5
- 462 Pitford Dr
- 96 Village Square Rd
- 380 E 400 N
- 951 Centerville Commons Way
- 56 W 200 N
- 330 W Paradiso Ln
- 1420 N Main St
- 295 E 500 N
Your Personal Tour Guide
Ask me questions while you tour the home.