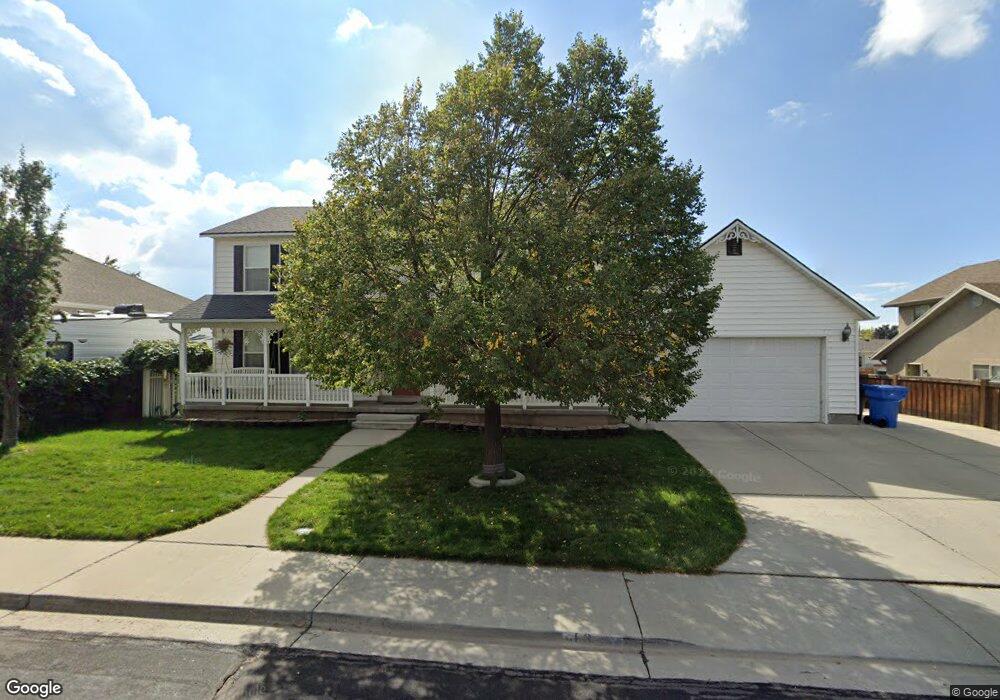
463 W 500 S Unit 3 Orem, UT 84058
Sunset Heights NeighborhoodEstimated Value: $583,055 - $714,000
4
Beds
3
Baths
2,036
Sq Ft
$310/Sq Ft
Est. Value
About This Home
This home is located at 463 W 500 S Unit 3, Orem, UT 84058 and is currently estimated at $630,264, approximately $309 per square foot. 463 W 500 S Unit 3 is a home located in Utah County with nearby schools including Orem Elementary School, Lakeridge Jr High School, and Mountain View High School.
Ownership History
Date
Name
Owned For
Owner Type
Purchase Details
Closed on
Oct 27, 2009
Sold by
Beneficial Mortgage Co Of Utah
Bought by
Born Gregory and Born Rachel
Current Estimated Value
Home Financials for this Owner
Home Financials are based on the most recent Mortgage that was taken out on this home.
Original Mortgage
$187,900
Interest Rate
5%
Mortgage Type
New Conventional
Purchase Details
Closed on
Aug 19, 2009
Sold by
Branam Dave E and Branam Stephanie
Bought by
Beneficial Mortgage Co Of Utah
Purchase Details
Closed on
Feb 21, 2001
Sold by
Panda Bear Homes Inc
Bought by
Branam David E and Branam Stephanie
Purchase Details
Closed on
Feb 20, 2001
Sold by
Garoufalias Nicholas and Garoufalias Shantele
Bought by
Panda Homes Llc
Create a Home Valuation Report for This Property
The Home Valuation Report is an in-depth analysis detailing your home's value as well as a comparison with similar homes in the area
Home Values in the Area
Average Home Value in this Area
Purchase History
| Date | Buyer | Sale Price | Title Company |
|---|---|---|---|
| Born Gregory | -- | Backman Title Services Ltd | |
| Beneficial Mortgage Co Of Utah | $248,400 | Inwest Title Services Sal | |
| Branam David E | -- | -- | |
| Panda Homes Llc | -- | Access Title Company |
Source: Public Records
Mortgage History
| Date | Status | Borrower | Loan Amount |
|---|---|---|---|
| Closed | Born Gregory | $187,900 |
Source: Public Records
Tax History Compared to Growth
Tax History
| Year | Tax Paid | Tax Assessment Tax Assessment Total Assessment is a certain percentage of the fair market value that is determined by local assessors to be the total taxable value of land and additions on the property. | Land | Improvement |
|---|---|---|---|---|
| 2025 | $2,367 | $293,205 | $240,700 | $292,400 |
| 2024 | $2,367 | $289,410 | $0 | $0 |
| 2023 | $2,236 | $293,865 | $0 | $0 |
| 2022 | $2,531 | $322,300 | $0 | $0 |
| 2021 | $2,427 | $468,000 | $188,000 | $280,000 |
| 2020 | $2,270 | $430,200 | $163,500 | $266,700 |
| 2019 | $2,163 | $426,400 | $163,500 | $262,900 |
| 2018 | $1,897 | $357,300 | $128,700 | $228,600 |
| 2017 | $1,691 | $170,555 | $0 | $0 |
| 2016 | $1,764 | $164,120 | $0 | $0 |
| 2015 | $1,777 | $156,365 | $0 | $0 |
| 2014 | $1,720 | $150,645 | $0 | $0 |
Source: Public Records
Map
Nearby Homes
- 492 S 400 W
- 397 W 400 S
- 656 W 550 S
- 193 W 530 S
- 725 W 630 S
- 740 W 580 S
- 790 W 550 S
- 520 S 800 W Unit 14
- 570 S 800 West St Unit 15
- 506 S 800 West St Unit 13
- 839 S 725 W
- 881 S 635 W
- 560 S 880 West St Unit 1
- 302 W 100 S
- 849 W 225 S
- 87 E 600 S Unit D
- 55 Hanover Dr
- 272 S Ridgecrest Dr
- 458 W 40 N
- 508 W 40 N