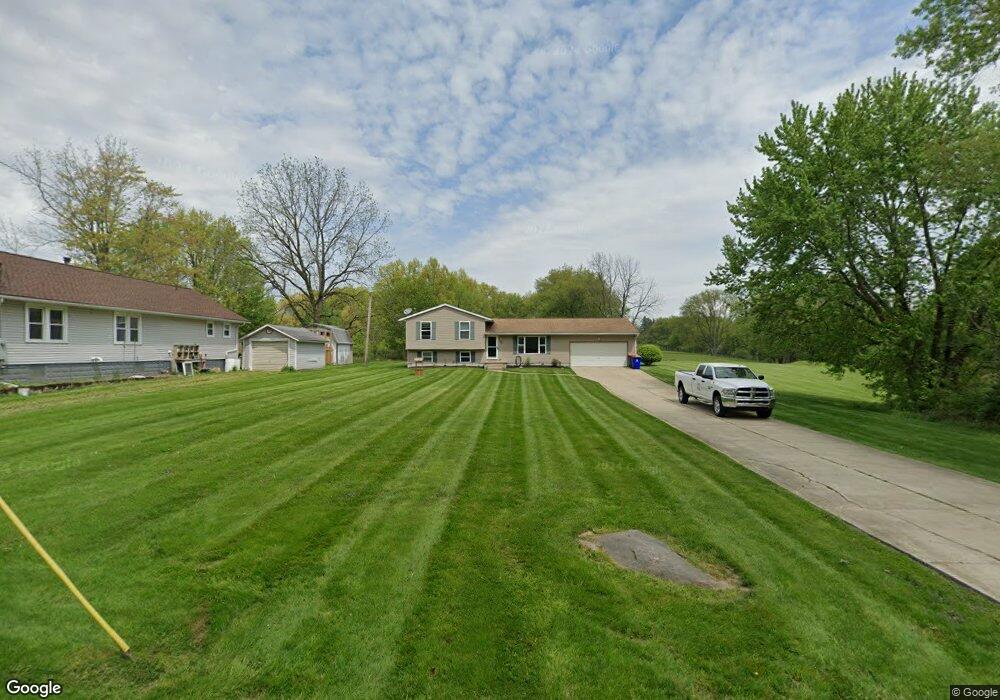
463 Weakland Rd Mogadore, OH 44260
Estimated Value: $313,113 - $418,000
3
Beds
2
Baths
1,804
Sq Ft
$197/Sq Ft
Est. Value
About This Home
This home is located at 463 Weakland Rd, Mogadore, OH 44260 and is currently estimated at $354,778, approximately $196 per square foot. 463 Weakland Rd is a home located in Portage County with nearby schools including Suffield Elementary School, Field Middle School, and Field High School.
Ownership History
Date
Name
Owned For
Owner Type
Purchase Details
Closed on
Nov 25, 2009
Sold by
Mcleary Robert L and Mcleary Tina L
Bought by
Mcleary Robert L and Mcleary Shirley Fay
Current Estimated Value
Purchase Details
Closed on
May 10, 2002
Sold by
Morris Ramey Terry
Bought by
Mccleary Robert L
Home Financials for this Owner
Home Financials are based on the most recent Mortgage that was taken out on this home.
Original Mortgage
$133,500
Interest Rate
6.79%
Mortgage Type
Construction
Purchase Details
Closed on
Dec 8, 1992
Bought by
Ramey Terry and Ramey Emery
Create a Home Valuation Report for This Property
The Home Valuation Report is an in-depth analysis detailing your home's value as well as a comparison with similar homes in the area
Purchase History
| Date | Buyer | Sale Price | Title Company |
|---|---|---|---|
| Mcleary Robert L | $170,000 | Diamond Title Co | |
| Mccleary Robert L | $35,000 | -- | |
| Ramey Terry | -- | -- |
Source: Public Records
Mortgage History
| Date | Status | Borrower | Loan Amount |
|---|---|---|---|
| Previous Owner | Mccleary Robert L | $133,500 |
Source: Public Records
Tax History
| Year | Tax Paid | Tax Assessment Tax Assessment Total Assessment is a certain percentage of the fair market value that is determined by local assessors to be the total taxable value of land and additions on the property. | Land | Improvement |
|---|---|---|---|---|
| 2025 | $4,111 | $94,470 | $18,480 | $75,990 |
| 2024 | $3,752 | $94,470 | $18,480 | $75,990 |
| 2023 | $3,508 | $72,110 | $14,530 | $57,580 |
| 2022 | $3,511 | $72,110 | $14,530 | $57,580 |
| 2021 | $3,481 | $72,110 | $14,530 | $57,580 |
| 2020 | $2,874 | $62,520 | $14,530 | $47,990 |
| 2019 | $2,889 | $62,520 | $14,530 | $47,990 |
| 2018 | $2,201 | $57,830 | $12,710 | $45,120 |
| 2017 | $2,201 | $57,830 | $12,710 | $45,120 |
| 2016 | $2,186 | $57,830 | $12,710 | $45,120 |
| 2015 | $2,187 | $57,830 | $12,710 | $45,120 |
| 2014 | $2,128 | $57,830 | $12,710 | $45,120 |
| 2013 | $2,110 | $57,830 | $12,710 | $45,120 |
Source: Public Records
Map
Nearby Homes
- 800 Martin Rd
- 1660 Martin Rd
- 1246 Marsh Fern Ln
- 3362 Brentwood Dr
- S/L 38 1150 Lakeview Dr
- S/L 11 959 Sunrise Dr
- 1011 Sunrise Way
- 1065 Etter Rd
- VL 863 State Route 43
- 1464 Blair Dr
- 3503 Brunk Rd
- 3200 Foxford Ct
- 994 Bookman Ave
- 1083 Reeves Ct
- 558 Lessig Ave
- 1940 Canton Rd
- 3194 Castleton Ct
- 432 Edith Ave
- 3774 Argonne St
- 360 James Ave
- 453 Weakland Rd
- 481 Holmes Ave
- 452 Weakland Rd
- 464 Weakland Rd
- 439 Weakland Rd
- 438 Weakland Rd
- 418 Weakland Rd
- 413 Weakland Rd
- 1123 Mishler Rd
- 1073 Mishler Rd
- 408 Weakland Rd
- 1085 Mishler Rd
- 1063 Mishler Rd
- 1041 Mishler Rd
- 387 Weakland Rd
- 9999 Mishler Rd
- 398 Weakland Rd
- 385 Weakland Rd
- 378 Weakland Rd
- 1009 Mishler Rd
Your Personal Tour Guide
Ask me questions while you tour the home.