Estimated Value: $398,000 - $415,000
5
Beds
2
Baths
1,781
Sq Ft
$226/Sq Ft
Est. Value
About This Home
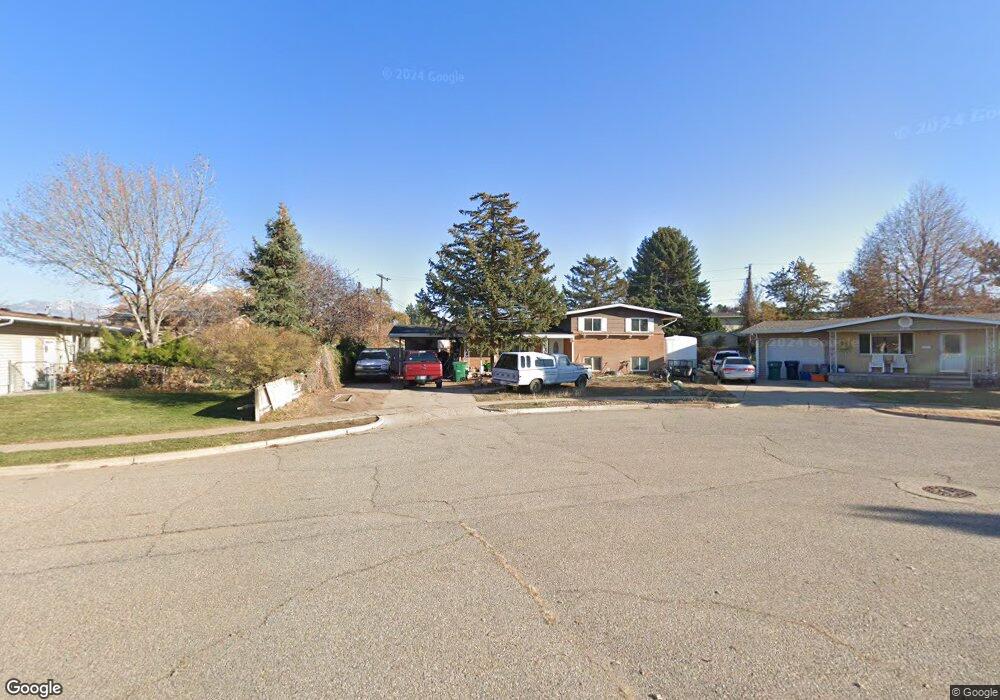
This home is located at 4630 S 2450 W, Roy, UT 84067 and is currently estimated at $403,178, approximately $226 per square foot. 4630 S 2450 W is a home located in Weber County with nearby schools including Valley View School, Sand Ridge Junior High School, and Roy High School.
Ownership History
Date
Name
Owned For
Owner Type
Purchase Details
Closed on
Dec 4, 2020
Sold by
Pearson Glenn
Bought by
Smith Gabriel R and Smith Mariah T
Current Estimated Value
Home Financials for this Owner
Home Financials are based on the most recent Mortgage that was taken out on this home.
Original Mortgage
$284,747
Outstanding Balance
$253,962
Interest Rate
2.8%
Mortgage Type
FHA
Estimated Equity
$149,216
Purchase Details
Closed on
Aug 18, 2020
Sold by
Crespo Margarita Osuna and Crespo Margarita O
Bought by
Pearson Glenn
Home Financials for this Owner
Home Financials are based on the most recent Mortgage that was taken out on this home.
Original Mortgage
$233,000
Interest Rate
3%
Mortgage Type
New Conventional
Purchase Details
Closed on
Mar 6, 1998
Sold by
Dupaix David J and Dupaix Laura J
Bought by
Marquez Jose and Crespo Margarita Osuna
Home Financials for this Owner
Home Financials are based on the most recent Mortgage that was taken out on this home.
Original Mortgage
$91,002
Interest Rate
6.99%
Mortgage Type
FHA
Create a Home Valuation Report for This Property
The Home Valuation Report is an in-depth analysis detailing your home's value as well as a comparison with similar homes in the area
Home Values in the Area
Average Home Value in this Area
Purchase History
| Date | Buyer | Sale Price | Title Company |
|---|---|---|---|
| Smith Gabriel R | -- | Greenbrier Title | |
| Pearson Glenn | -- | Backman Ntp | |
| Marquez Jose | -- | Associated Title |
Source: Public Records
Mortgage History
| Date | Status | Borrower | Loan Amount |
|---|---|---|---|
| Open | Smith Gabriel R | $284,747 | |
| Closed | Smith Gabriel R | $11,389 | |
| Previous Owner | Pearson Glenn | $233,000 | |
| Previous Owner | Marquez Jose | $91,002 |
Source: Public Records
Tax History
| Year | Tax Paid | Tax Assessment Tax Assessment Total Assessment is a certain percentage of the fair market value that is determined by local assessors to be the total taxable value of land and additions on the property. | Land | Improvement |
|---|---|---|---|---|
| 2025 | $2,375 | $371,058 | $122,630 | $248,428 |
| 2024 | $2,320 | $200,749 | $67,447 | $133,302 |
| 2023 | $2,162 | $186,450 | $64,239 | $122,211 |
| 2022 | $2,403 | $216,150 | $55,729 | $160,421 |
| 2021 | $1,811 | $264,000 | $71,325 | $192,675 |
| 2020 | $1,669 | $223,000 | $71,325 | $151,675 |
| 2019 | $1,567 | $196,000 | $40,995 | $155,005 |
| 2018 | $1,460 | $171,000 | $36,920 | $134,080 |
| 2017 | $1,317 | $143,000 | $36,920 | $106,080 |
| 2016 | $1,294 | $75,729 | $19,302 | $56,427 |
| 2015 | $1,165 | $69,168 | $19,302 | $49,866 |
| 2014 | $1,175 | $69,168 | $16,433 | $52,735 |
Source: Public Records
Map
Nearby Homes
Your Personal Tour Guide
Ask me questions while you tour the home.