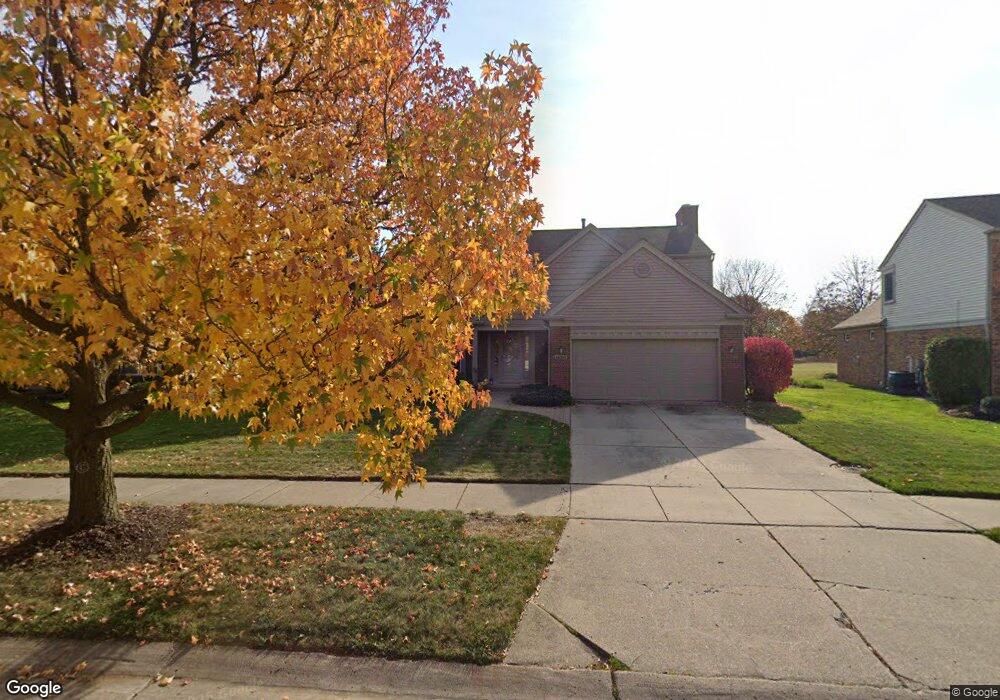
46309 Briargate Dr Canton, MI 48187
Sunflower Village NeighborhoodEstimated Value: $481,343 - $570,000
Studio
3
Baths
2,356
Sq Ft
$225/Sq Ft
Est. Value
About This Home
This home is located at 46309 Briargate Dr, Canton, MI 48187 and is currently estimated at $529,086, approximately $224 per square foot. 46309 Briargate Dr is a home located in Wayne County with nearby schools including Canton High School, Plymouth High School, and Salem High School.
Ownership History
Date
Name
Owned For
Owner Type
Purchase Details
Closed on
Dec 15, 2015
Sold by
Cassidy Thomas and Cassidy Helene
Bought by
Cassidy Family Revocable Living Trust
Current Estimated Value
Purchase Details
Closed on
Oct 2, 2015
Sold by
Cassidy Family Revocable Living Trust
Bought by
Cassidy Thomas and Cassidy Helene
Home Financials for this Owner
Home Financials are based on the most recent Mortgage that was taken out on this home.
Original Mortgage
$187,700
Outstanding Balance
$75,997
Interest Rate
3.84%
Mortgage Type
New Conventional
Estimated Equity
$453,089
Purchase Details
Closed on
Mar 2, 2010
Sold by
Cassidy Thomas M and Cassidy Helene R
Bought by
Cassidy Thomas M and Cassidy Helene R
Purchase Details
Closed on
Jul 15, 2000
Sold by
Pezolt Daniel J
Bought by
Cassidy Helene R
Purchase Details
Closed on
Jan 2, 1998
Sold by
Kenn Debra K and Kenn Richard G
Bought by
Pezolt Daniel J
Create a Home Valuation Report for This Property
The Home Valuation Report is an in-depth analysis detailing your home's value as well as a comparison with similar homes in the area
Home Values in the Area
Average Home Value in this Area
Purchase History
| Date | Buyer | Sale Price | Title Company |
|---|---|---|---|
| Cassidy Family Revocable Living Trust | -- | Title Solutions Agency Llc | |
| Cassidy Thomas | -- | Title Solutions Agency Llc | |
| Cassidy Thomas M | -- | Greco | |
| Cassidy Helene R | $282,500 | -- | |
| Pezolt Daniel J | $238,700 | -- |
Source: Public Records
Mortgage History
| Date | Status | Borrower | Loan Amount |
|---|---|---|---|
| Open | Cassidy Thomas | $187,700 |
Source: Public Records
Tax History
| Year | Tax Paid | Tax Assessment Tax Assessment Total Assessment is a certain percentage of the fair market value that is determined by local assessors to be the total taxable value of land and additions on the property. | Land | Improvement |
|---|---|---|---|---|
| 2025 | $2,422 | $219,700 | $0 | $0 |
| 2024 | $2,353 | $199,700 | $0 | $0 |
| 2023 | $2,243 | $187,200 | $0 | $0 |
| 2022 | $4,908 | $174,800 | $0 | $0 |
| 2021 | $4,763 | $167,200 | $0 | $0 |
| 2020 | $4,703 | $168,900 | $0 | $0 |
| 2019 | $4,635 | $155,270 | $0 | $0 |
| 2018 | $1,914 | $146,900 | $0 | $0 |
| 2017 | $4,725 | $141,200 | $0 | $0 |
| 2016 | $4,217 | $139,700 | $0 | $0 |
| 2015 | $10,518 | $133,450 | $0 | $0 |
| 2013 | $10,190 | $108,890 | $0 | $0 |
| 2010 | -- | $109,560 | $53,342 | $56,218 |
Source: Public Records
Map
Nearby Homes
- 7459 Admiralty Dr
- 45900 Gainsborough Dr
- 45677 Radnor Rd
- 6857 Bridgemont Dr
- 48123 Covington Ct
- 00000 Maben Rd
- 48107 Hanford Rd
- 48590 Ford Rd
- 0 N Beck Rd
- 45261 Patrick Dr
- 0000 Ford
- 5885 Fairborn Dr
- 1725 Gorman St
- 48406 Warren Rd
- 6852 New Providence Way Unit 104
- 44432 Newburyport Dr
- 49044 Poppleton Ct
- 5922 Valley View Dr
- 1632 Peninsula Ct Unit 159
- 49772 Shoreline Dr
- 46291 Briargate Dr
- 46315 Briargate Dr
- 46321 Briargate Dr
- 6969 Weatherfield Way
- 6951 Weatherfield Way
- 46292 Briargate Dr
- 46310 Briargate Dr
- 46327 Briargate Dr
- 7005 Weatherfield Way
- 7023 Weatherfield Way
- 7056 Oakleaf Ct
- 6950 Weathersfield Way
- 7029 Oakleaf Ct
- 7041 Weatherfield Way
- 7084 Oakleaf Ct
- 7057 Oakleaf Ct
- 6968 Weatherfield Way
- 6950 Weatherfield Way
- 6986 Weathersfield Way
- 6986 Weatherfield Way
Your Personal Tour Guide
Ask me questions while you tour the home.